2024-04-10 · Overview figure
Contents
2024-04-10 · Overview figure
include("lib/Nto1.jl")
using Revise … ✔
using Units, Nto1AdEx, ConnectionTests, ConnTestEval, MemDiskCache … ✔
using StatsBase … ✔
Sim
N = 6500
duration = 10minutes
spike_SNR = 40;
@time sim = Nto1AdEx.sim(N, duration);
1.635046 seconds (21.49 k allocations: 912.268 MiB, 10.06% gc time)
sig = VI_sig(sim; spike_SNR);
include("lib/plot.jl")
import PythonCall … ✔
import PythonPlot … ✔
using Sciplotlib … ✔
using PhDPlots … ✔
plotsig(sig, [0,1000], ms, yunit=:mV);
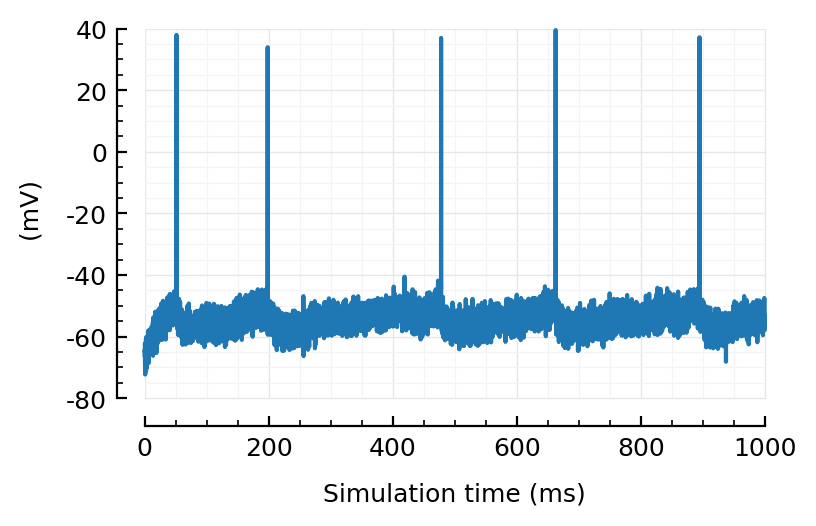
p = 99.9
percentile(sig, p) / mV
-42.1
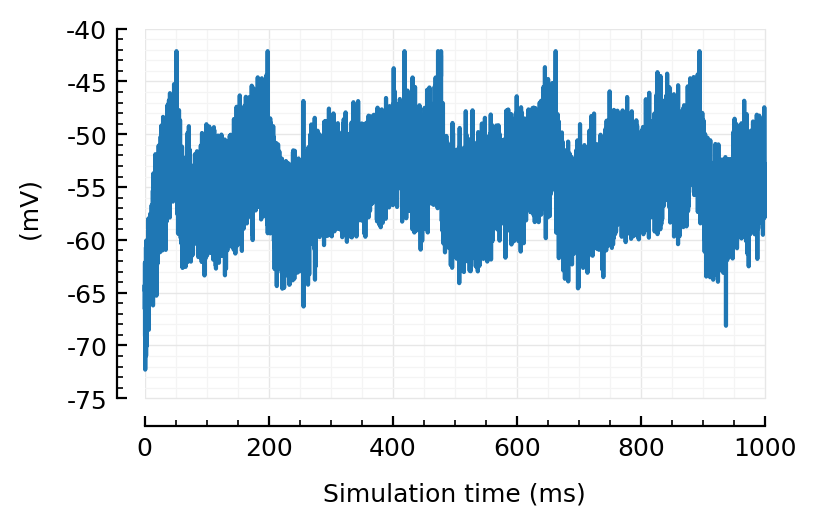
sigc = clip!(copy(sig), p);
plotsig(sigc, [0,1000], ms, yunit=:mV);
Aside: Otsu-like method to find spike / clipping threshold?
hist(sig[sig .> -42.1mV] / mV, xlabel="mV");

So yes it seems possible (given that our percentile is ± right..). But let’s skip here and take fixed pctile value as threshold.
Although: setting all those ceiled values to e.g. 0mV is still not good (They’re still peaks, so still lotsa noise added). Better if they’re set to e.g. the mean (around -58 mV) or somehow excluded.
Test
highest_firing_inputs = get_trains_to_test(sim, Nₜ = 10);
linefit_method = ConnectionTests.FitUpstroke(
    winsize = 100,  # 10 ms
    offset = 0,
)
linefit_test(sig, spiketimes) = test_conn(linefit_method, sig, spiketimes);
function spike_corr_test(post_spikes, pre_spikes)
    # weird arg order is remnant of voltage based conntests function signature:
    # `test(sig, spikes)`  ('big arg first' convention)

end
conntest_methods = [
    ("Spikes-only", spike_corr_test),
    ("STA height", STA_test),
    ("Line fit", linefit_test),
];
include("lib/df.jl")
using DataFrames … ✔
rows = []

for (method, f) in conntest_methods
    println(method)
    if f == spike_corr_test
        post_sig = sim.spiketimes
    else
        post_sig = sigc
    end
    t0 = time()
    spiketrain_rows = test_inputs(sim, post_sig, highest_firing_inputs, f)
    compute_time = time() - t0
    df = DataFrame(spiketrain_rows)
    sweep = sweep_threshold(df)
    row = (;
        method,
        AUC = calc_AUROCs(sweep).AUC,
        F1max = maximum(skipnan(sweep.F1)),
        compute_time,
    )
    push!(rows, row)
    println()
end

df = DataFrame(rows)
exc 100%|████████████████████████████████████████████████| Time: 0:00:04
inh 100%|████████████████████████████████████████████████| Time: 0:00:02
unc 100%|████████████████████████████████████████████████| Time: 0:00:02
exc 100%|████████████████████████████████████████████████| Time: 0:00:01
inh 100%|████████████████████████████████████████████████| Time: 0:00:01
unc 100%|████████████████████████████████████████████████| Time: 0:00:01
2×4 DataFrame
| Row | method | AUC | F1max | compute_time |
|---|---|---|---|---|
| String | Float64 | Float64 | Float64 | |
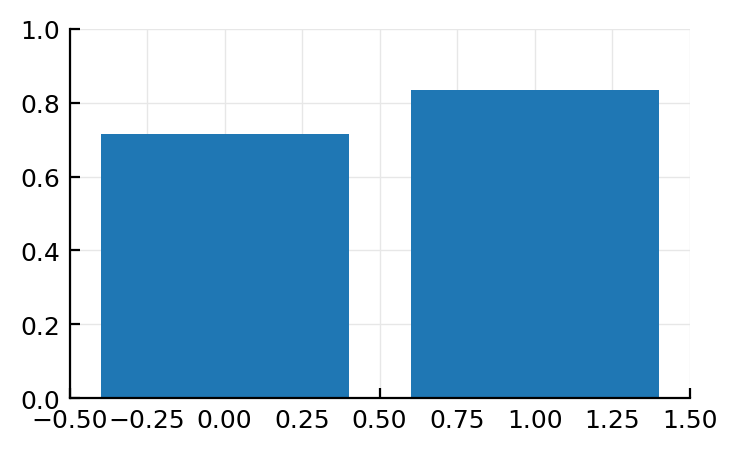
| 1 | STA height | 0.5 | 0.714 | 9.62 |
| 2 | Line fit | 0.805 | 0.833 | 3.6 |
fig, ax = plt.subplots()
ax.bar([0, 1], df.F1max);