2022-03-02 • Duration & SNR for big-N–to–1
Contents
2022-03-02 • Duration & SNR for big-N–to–1
Setup
#
using Revise
using MyToolbox
using VoltageToMap
[ Info: Precompiling VoltageToMap [b3b8fdc5-3c26-4000-a0c8-f17415fdf48e]
Params & sim
Short warm-up run. Get compilation out of the way.
p0 = ExperimentParams(
    sim = SimParams(
        input = previous_N_30_input,
        duration = 1 * minutes
    )
);
@time sim(p0.sim);
Progress: 100%|█████████████████████████████████████████| Time: 0:00:01
  3.929238 seconds (8.80 M allocations: 598.610 MiB, 11.79% gc time, 86.25% compilation time)
p = ExperimentParams(
    sim = SimParams(
        input = realistic_N_6600_input,
        duration = 0.2 * minutes,
        synapses = SynapseParams(
            Δg_multiplier = 0.066,
        ),
    )
);
dumps(p)
ExperimentParams
  rngseed: 22022022
  sim: SimParams
    duration: 12.0
    Δt: 0.0001
    num_timesteps: 120000
    rngseed: 0
    input: PoissonInputParams
      N_unconn: 100
      N_exc: 5200
      N_inh: 1300
      N_conn: 6500
      N: 6600
      spike_rates: LogNormal
        μ: 1.08629
        σ: 0.774597
    synapses: SynapseParams
      Δg_exc: 4.0e-10
      Δg_inh: 1.6e-9
      Δg_multiplier: 0.066
      E_exc: 0.0
      E_inh: -0.065
      g_t0: 0.0
      τ: 0.007
    izh_neuron: IzhikevichParams
      C: 1.0e-10
      k: 7.0e-7
      v_rest: -0.06
      v_thr: -0.04
      a: 30.0
      b: -2.0e-9
      v_peak: 0.035
      v_reset: -0.05
      Δu: 1.0e-10
      v_t0: -0.06
      u_t0: 0.0
    imaging: VoltageImagingParams
      spike_SNR: 10.0
      spike_SNR_dB: 20.0
      spike_height: 0.095
      σ_noise: 0.0095
  conntest: ConnTestParams
    STA_window_length: 0.1
    num_shuffles: 100
    rngseed: 22022022
  evaluation: EvaluationParams
    num_tested_neurons_per_group: 40
    rngseed: 22022022
t, v, vimsig, input_spikes = @time sim(p.sim);
Progress: 100%|█████████████████████████████████████████| Time: 0:00:02
  4.708045 seconds (4.80 M allocations: 372.494 MiB, 2.00% gc time, 39.88% compilation time)
num_spikes = length.(input_spikes)
ComponentVector{Int64}(conn = (exc = [24, 18, 27, 22, 12, 23, 20, 6, 18, 18 … 20, 18, 26, 22, 7, 12, 26, 8, 22, 15], inh = [7, 19, 16, 1, 19, 13, 21, 22, 3, 14 … 27, 15, 21, 7, 22, 26, 20, 17, 18, 27]), unconn = [22, 18, 15, 22, 29, 17, 12, 29, 14, 14 … 29, 16, 20, 4, 28, 27, 28, 11, 10, 8])
Plot
import PyPlot
using VoltageToMap.Plot
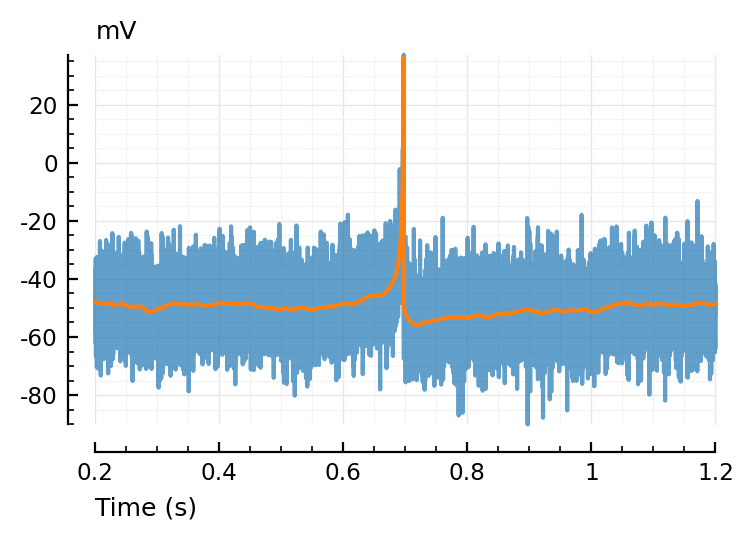
tzoom = [200, 1200]ms
ax = plotsig(t, vimsig / mV, tzoom; xlabel="Time (s)", hylabel="mV", alpha=0.7);
plotsig(t, v / mV, tzoom; ax);

Test conntest
example_presynspikes = input_spikes.conn.exc[44]
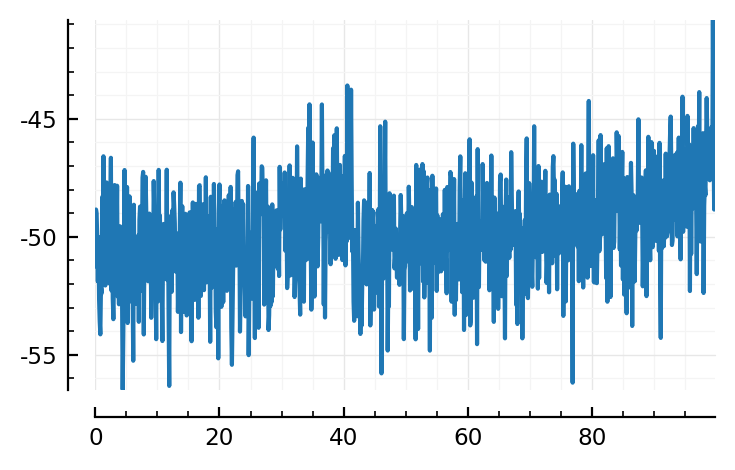
plotSTA(vimsig, example_presynspikes, p);

p_value = test_connection(vimsig, example_presynspikes, p)
0.61
Conntest performance
N_eval_trains = p.evaluation.num_tested_neurons_per_group
40
α = 0.05;
function evaluate_conntest_performance(vimsig, input_spikes, p)

    resetrng!(p.evaluation.rngseed)

    TP_exc = 0
    TP_inh = 0
    TP_unconn = 0

    for input_train in input_spikes.conn.exc[1:N_eval_trains]
        p_value = test_connection(vimsig, input_train, p)
        if p_value < α
            TP_exc += 1
        end
    end

    for input_train in input_spikes.conn.inh[1:N_eval_trains]
        p_value = test_connection(vimsig, input_train, p)
        if p_value > 1 - α
            TP_inh += 1
        end
    end

    for input_train in input_spikes.unconn[1:N_eval_trains]
        p_value = test_connection(vimsig, input_train, p)
        if α/2 ≤ p_value ≤ 1 - α/2
            TP_unconn += 1
        end
    end

    TPR_exc    = TP_exc / N_eval
    TPR_inh    = TP_inh / N_eval
    TPR_unconn = TP_unconn / N_eval

    FPR = 1 - TPR_unconn

    return TPR_exc, TPR_inh, FPR
end;
evaluate_conntest_performance(vimsig, input_spikes, p)
(0.05, 0.025, 0.025000000000000022)
Performance for given params
function performance_for(p::ExperimentParams)
    _t, _v, vimsig, input_spikes = sim(p.sim);
    return evaluate_conntest_performance(vimsig, input_spikes, p)
end;
VI_params = VoltageImagingParams(;
    spike_height = cortical_RS.v_peak - cortical_RS.v_rest,
    spike_SNR = Inf,
);
durations = [
    30 * seconds,
    1 * minutes,
    5 * minutes,
    10 * minutes,
    20 * minutes,
    30 * minutes,
]
xlabels = durations / minutes .|> x -> @sprintf "%.3G" x;
TPRs_exc = Vector{Float64}()
TPRs_inh = Vector{Float64}()
FPRs     = Vector{Float64}()

for duration in durations
    @show duration / minutes
    params = ExperimentParams(sim = SimParams(; duration, imaging = VI_params))
    TPR_exc, TPR_inh, FPR = performance_for(params)
    @show TPR_exc, TPR_inh, FPR
    push!(TPRs_exc, TPR_exc)
    push!(TPRs_inh, TPR_inh)
    push!(FPRs, FPR)
    println()
end
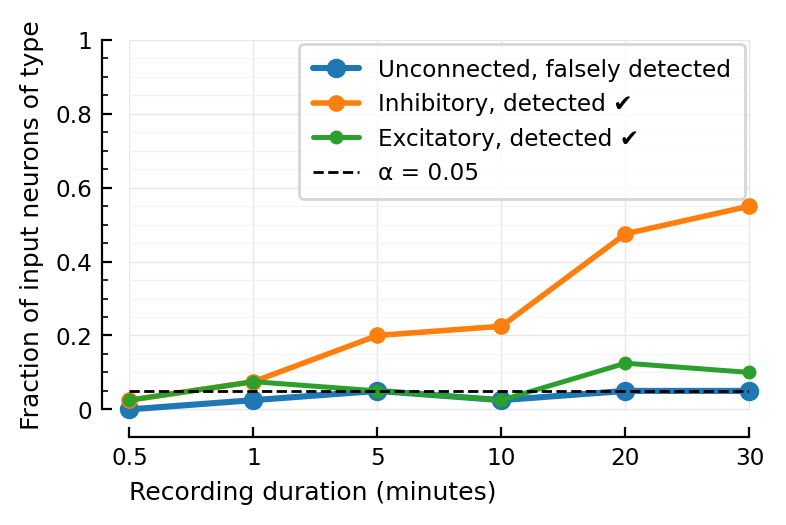
duration / minutes = 0.5
Progress: 100%|█████████████████████████████████████████| Time: 0:00:06
(TPR_exc, TPR_inh, FPR) = (0.025, 0.025, 0.0)

duration / minutes = 1.0
Progress: 100%|█████████████████████████████████████████| Time: 0:00:15
(TPR_exc, TPR_inh, FPR) = (0.075, 0.075, 0.025000000000000022)

duration / minutes = 5.0
Progress: 100%|█████████████████████████████████████████| Time: 0:01:26
(TPR_exc, TPR_inh, FPR) = (0.05, 0.2, 0.050000000000000044)

duration / minutes = 10.0
Progress: 100%|█████████████████████████████████████████| Time: 0:02:30
(TPR_exc, TPR_inh, FPR) = (0.025, 0.225, 0.025000000000000022)

duration / minutes = 20.0
Progress: 100%|█████████████████████████████████████████| Time: 0:05:24
(TPR_exc, TPR_inh, FPR) = (0.125, 0.475, 0.050000000000000044)

duration / minutes = 30.0
Progress: 100%|█████████████████████████████████████████| Time: 0:07:40
(TPR_exc, TPR_inh, FPR) = (0.1, 0.55, 0.050000000000000044)
xticks = [1:length(durations);]
plott(rates; kw...) = plot(
    xticks, rates, ".-"; ylim=(0,1),
    xminorticks=false, clip_on=false, kw...
)
smaller = (lw=1.8, ms=08)
medium  = (lw=2.0, ms=10)
larger  = (lw=2.2, ms=12)
ax = plott(FPRs;      larger...,  label="Unconnected, falsely detected")
ax = plott(TPRs_inh;  medium...,  label="Inhibitory, detected ✔")
ax = plott(TPRs_exc;  smaller..., label="Excitatory, detected ✔")
ax.set_xticks(xticks, xlabels)
ax.set_xlabel("Recording duration (minutes)")
ax.set_ylabel("Fraction of input neurons of type")
ax.axhline(α, color="black", zorder=3, lw=1, linestyle="dashed", label=f"α = {α:.3G}")
ax.legend();
