2023-08-10__speedtest_end-to-end_nb_worfklow_pyjulia
2023-08-10__speedtest_end-to-end_nb_worfklow_pyjulia
1
%%time
from julia import Pkg
CPU times: total: 2.81 s
Wall time: 4.84 s
%%time
Pkg.activate("..")
# Pkg.status()
# output is in nb terminal
CPU times: total: 641 ms
Wall time: 1.86 s
%%time
from julia import Nto1AdEx
CPU times: total: 15.6 ms
Wall time: 25.6 ms
%%time
Nto1AdEx.wₑ = 15 / 1e9
Nto1AdEx.wᵢ = 4 * Nto1AdEx.wₑ
out = Nto1AdEx.sim(6500, 10);
CPU times: total: 594 ms
Wall time: 1.32 s
%%time
import matplotlib as mpl
import matplotlib.pyplot as plt
CPU times: total: 344 ms
Wall time: 1.02 s
%%time
from brian2.units import *
CPU times: total: 1.28 s
Wall time: 3.64 s
V = (out.V * volt)
\[\left[\begin{matrix}-65. & -64.99986538 & -64.99623327 & \dots & -54.53301958 & -54.51563329 & -54.49719995\end{matrix}\right]\,\mathrm{m}\mathrm{V}\]
Ok, seems that brian2.units imported that
%%time
%run lib/plot.py
CPU times: total: 0 ns
Wall time: 18.8 ms
%%time
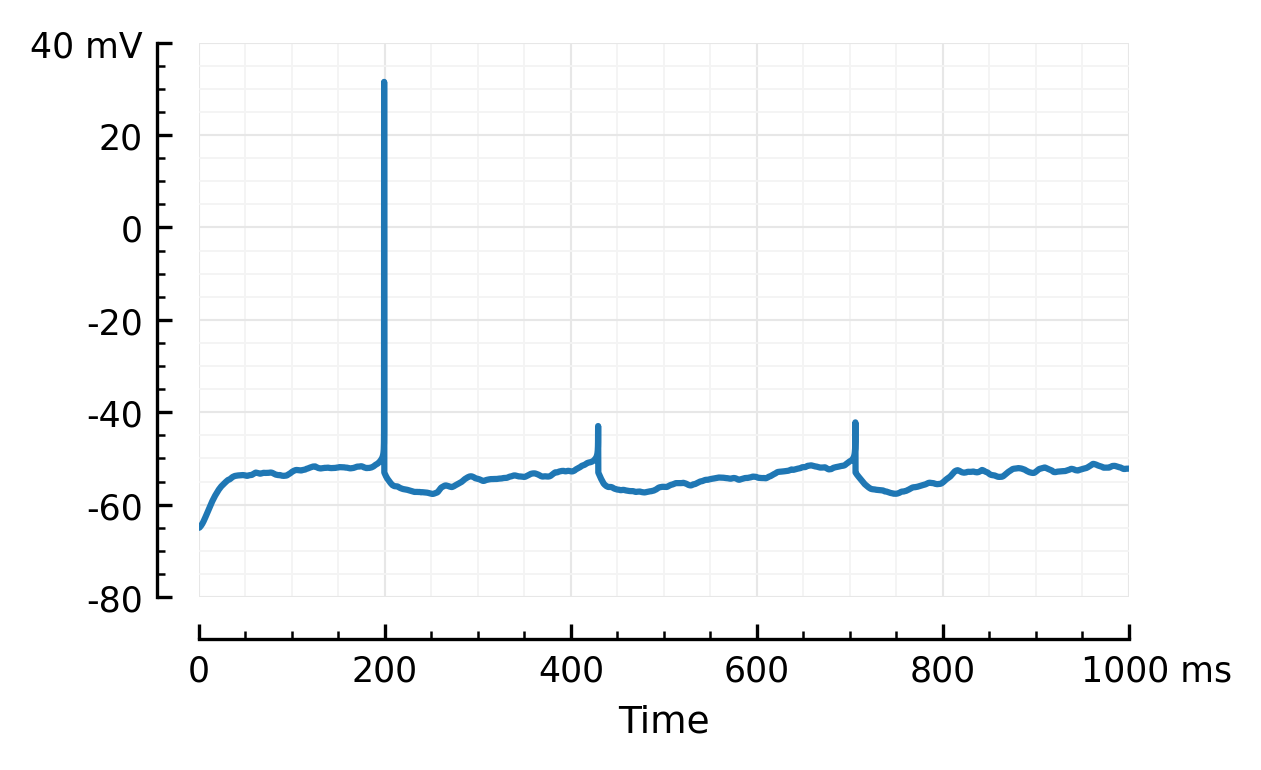
plotsig(V, tlim=[0,1000]*ms);
CPU times: total: 250 ms
Wall time: 822 ms
<Axes: xlabel='Time'>

‘Restart and run all’:
~15 seconds total
First cell after ~3”
(after a few warm up restarts-and-run-alls).
Breakdown of the 15”:
0 à 3 sec nb/py startup
7 sec julia startup
3 sec mpl/np/brian import
1 sec plot
(note the
%%timereported in mpl cell is always signif shorter than the real time until the plot appears on screen)