2022-09-09 • Connection test using template matching
Contents
2022-09-09 • Connection test using template matching
Params
p = get_params(
    duration = 10minutes,
    p_conn = 0.04,
    g_EE = 1,
    g_EI = 1,
    g_IE = 4,
    g_II = 4,
    ext_current = Normal(-0.5 * pA/√seconds, 5 * pA/√seconds),
    E_inh = -80 * mV,
    record_v = [1:40; 801:810],
);
Peak-to-peak perf
perf = cached_conntest_eval(s, 1, p)
perf.detection_rates
(TPR_exc = 0.615, TPR_inh = 0.9, FPR = 0.125)
(this is just for one postsyn neuron. For all 40 recorded, see here)
Can we get TPR_exc up?
Idea is to use a template STA to correlate STA with. Here we’ll cheat and use the average (E→E) STA as template (cheating cause it presumes knowledge of what’s connected). This is to test viability. If this works, we can move on to fitting a parametrized analytical STA shape to an individual STA (and then somehow compare it to shuffles..).
Template: average STA
using PyPlot
using VoltoMapSim.Plot
exc_post = [1:40;]
avgSTA = nothing
N = 0
@showprogress for n in exc_post
    ii = s.input_info[n]
    for m in ii.exc_inputs
        STA = calc_STA(m, n, s,p)
        if isnothing(avgSTA) avgSTA = STA
        else avgSTA .+= STA end
        N += 1
    end
end
avgSTA ./= N

plotsig(avgSTA / mV, p);
Progress: 100%|█████████████████████████████████████████| Time: 0:00:1239m39m
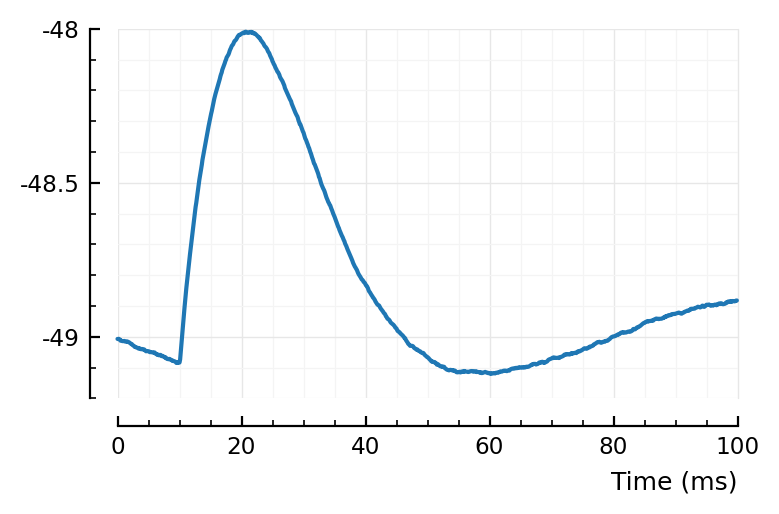
Great. Now we’ll use this for conntest.
We’ll take one difficult connection as example. (See previous notebook)
m = 136
n = 1
plotSTA(m, n, s,p);
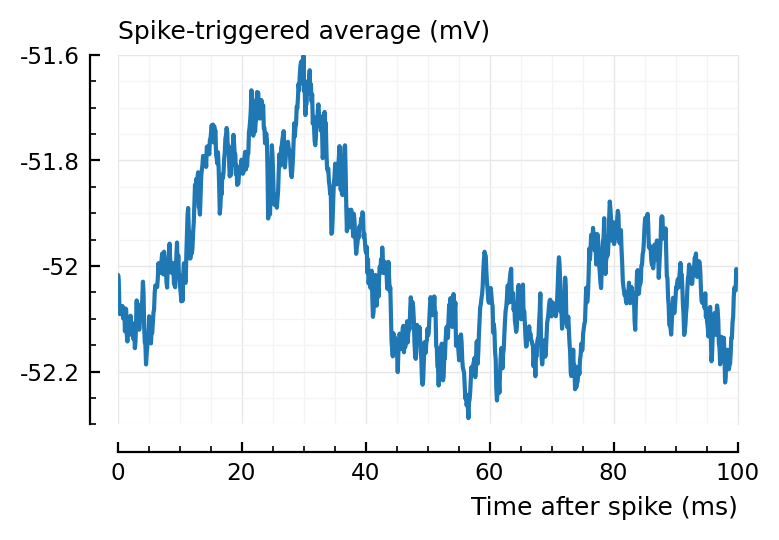
Pval of 136 was 0.09.
STA = calc_STA(m,n,s,p);
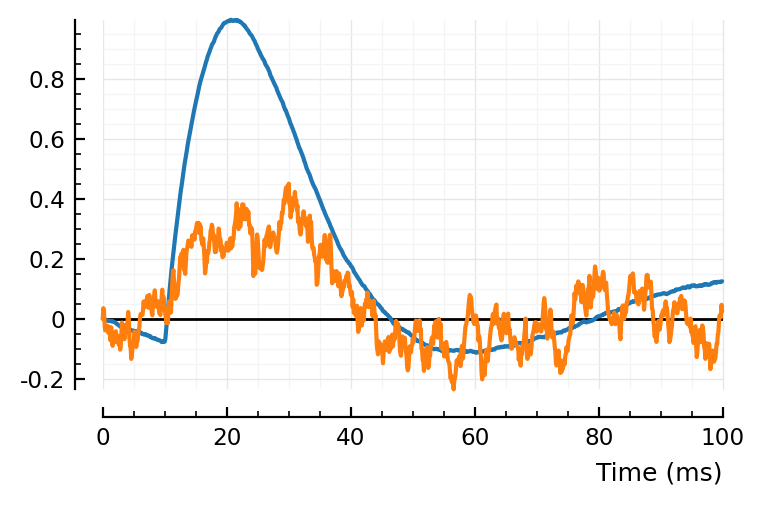
ref_to_start(sig) = sig .- sig[1]
fig,ax = plt.subplots()
plotsig(ref_to_start(avgSTA) / mV, p; ax)
plotsig(ref_to_start(STA) / mV, p; ax)
add_refline(ax);
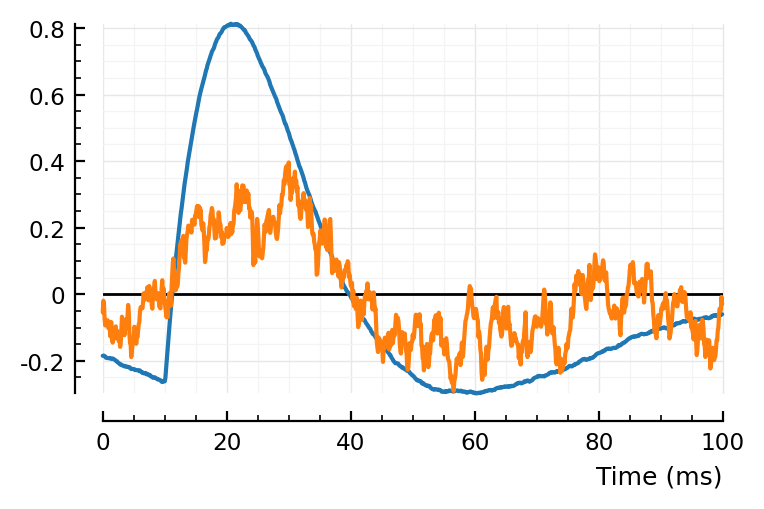
And what if we ref to mean? (Which is what’d happen if we’d calculate (Pearson) correlation between signal and template).
centre(sig) = sig .- mean(sig)
fig,ax = plt.subplots()
plotsig(centre(avgSTA) / mV, p; ax)
plotsig(centre(STA) / mV, p; ax)
add_refline(ax);
I like the former better, signals seem aligned better.
Though otoh, the first sample is more noisy than the mean of all samples of the STA.
Alright let’s go for mean centring.
corr = cor(STA, avgSTA)
0.84
Correlate shuffleds w/ template
Now do the same for shuffled STAs.
spikes = s.spike_times[m]
v = s.signals[n].v
shuffled_corrs = Float64[]
for i in 1:100
    shuffled_STA = calc_STA(v, shuffle_ISIs(spikes), p)
    push!(shuffled_corrs, cor(template, shuffled_STA))
end
ydistplot(shuffled_corrs, ref = corr, ylim = [-1,1]);
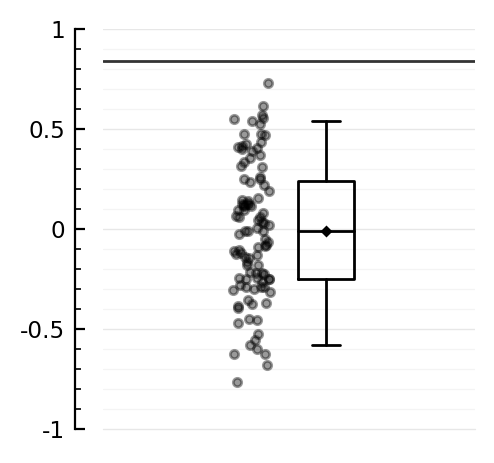
Aha, so for this one we beat the p = 0.09 :)
(with p < 0.01)
Use as conntest, for all exc inputs
We went to apply to all 1’s exc inputs now.
First, reuse our test_connection function in the codebase
(we add an argument f to pass an arbitrary test statistic function).
test_statistic(STA) = cor(STA, avgSTA)

pval = test_connection(v, spikes, p, test_statistic)
0.01
Good, same as above.
ii = s.input_info[n]
corrs = Float64[]
pvals = Float64[]
@showprogress for m in ii.exc_inputs
    push!(pvals, test_connection(v, s.spike_times[m], p, test_statistic))
    push!(corrs, cor(calc_STA(m,n,s,p), avgSTA))
end;
Progress: 100%|█████████████████████████████████████████| Time: 0:00:26
ENV["COLUMNS"] = 100;
tn = perf.tested_neurons
df = tn[tn.real_type .== :exc, :]
df.pval_with_template_corr = pvals
df.corr_with_template = corrs
df
26 rows × 7 columns
| input_neuron_ID | real_type | predicted_type | pval | area_over_start | pval_with_template_corr | corr_with_template | |
|---|---|---|---|---|---|---|---|
| Int64 | Symbol | Symbol | Float64 | Float64 | Float64 | Float64 | |
| 1 | 139 | exc | exc | 0.01 | 17 | 0.01 | 0.639 |
| 2 | 681 | exc | inh | 0.01 | -4 | 0.01 | 0.814 |
| 3 | 11 | exc | exc | 0.01 | 18 | 0.01 | 0.844 |
| 4 | 766 | exc | exc | 0.01 | 52 | 0.01 | 0.939 |
| 5 | 132 | exc | exc | 0.03 | 18.5 | 0.12 | 0.504 |
| 6 | 516 | exc | exc | 0.01 | 30.4 | 0.01 | 0.95 |
| 7 | 418 | exc | inh | 0.01 | -3.7 | 0.01 | 0.935 |
| 8 | 565 | exc | unconn | 0.05 | 18.7 | 0.01 | 0.735 |
| 9 | 597 | exc | exc | 0.01 | 26.3 | 0.01 | 0.956 |
| 10 | 446 | exc | exc | 0.01 | 19.4 | 0.01 | 0.876 |
| 11 | 447 | exc | exc | 0.01 | 40.3 | 0.01 | 0.881 |
| 12 | 710 | exc | exc | 0.01 | 28.6 | 0.01 | 0.929 |
| 13 | 66 | exc | exc | 0.01 | 8.29 | 0.01 | 0.899 |
| 14 | 136 | exc | unconn | 0.09 | 5.45 | 0.01 | 0.84 |
| 15 | 312 | exc | exc | 0.01 | 82.6 | 0.01 | 0.948 |
| 16 | 145 | exc | inh | 0.01 | -27.8 | 0.01 | 0.793 |
| 17 | 169 | exc | exc | 0.01 | 50.6 | 0.01 | 0.928 |
| 18 | 194 | exc | unconn | 0.35 | -1.99 | 0.01 | 0.689 |
| 19 | 629 | exc | exc | 0.01 | 4.7 | 0.01 | 0.679 |
| 20 | 352 | exc | unconn | 0.82 | -8.92 | 0.03 | 0.441 |
| 21 | 800 | exc | unconn | 0.72 | -4.17 | 0.01 | 0.707 |
| 22 | 303 | exc | exc | 0.01 | 2.51 | 0.01 | 0.9 |
| 23 | 101 | exc | unconn | 0.29 | 21.1 | 0.19 | 0.37 |
| 24 | 70 | exc | exc | 0.01 | 16.9 | 0.01 | 0.958 |
| 25 | 337 | exc | exc | 0.01 | 12 | 0.04 | 0.592 |
| 26 | 33 | exc | unconn | 0.18 | 10.6 | 0.35 | 0.102 |
Changes wrt previous statistic (peak-to-peak):
565, 136, 194, 352, 800 correctly detected now
101 and 33 still not detected (see prev nb for STA plots).
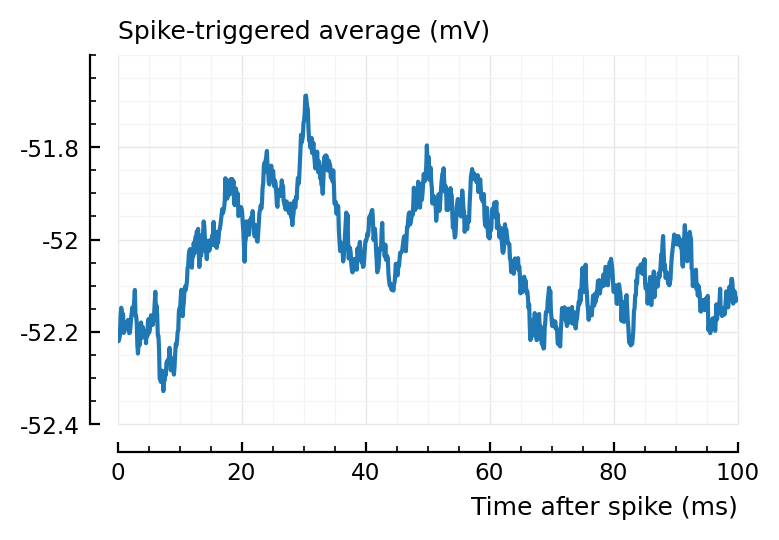
132 not detected anymore (and 337’s p value went up to 0.04)
plotSTA(132, 1, s,p);
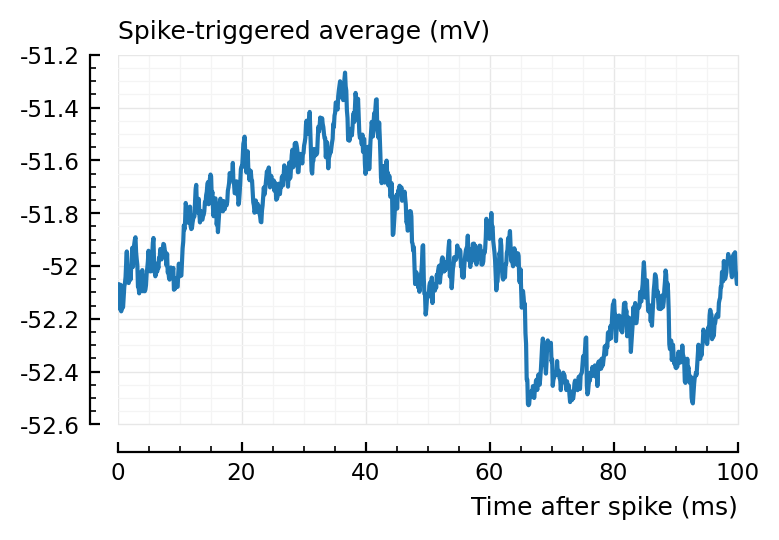
plotSTA(337, 1, s,p);
Ignoring the predicted type == inh for now (which is a different problem – though we might solve by using corr instead of area over start) ..
df = df[df.predicted_type .!= :inh, :]
# TPR_exc_ptp =
TPR_exc_ptp = count(df.pval .< 0.05) / nrow(df)
0.696
TPR_exc_template_match = count(df.pval_with_template_corr .< 0.05) / nrow(df)
0.87
That seems like an improvement.
Same but for inh inputs
test_statistic(STA) = -cor(STA, avgSTA);
Here we use the negative corr as test stat.
This will require determining the type of a potential connection first, before deciding whether it exists.
corrs = Float64[]
pvals = Float64[]
@showprogress for m in ii.inh_inputs
    push!(pvals, test_connection(v, s.spike_times[m], p, test_statistic))
    push!(corrs, cor(calc_STA(m,n,s,p), avgSTA))
end;
Progress: 100%|█████████████████████████████████████████| Time: 0:00:10
df = tn[tn.real_type .== :inh, :]
df.pval_with_template_corr = pvals
df.corrs_with_template = corrs
df
10 rows × 7 columns
| input_neuron_ID | real_type | predicted_type | pval | area_over_start | pval_with_template_corr | corrs_with_template | |
|---|---|---|---|---|---|---|---|
| Int64 | Symbol | Symbol | Float64 | Float64 | Float64 | Float64 | |
| 1 | 988 | inh | inh | 0.01 | -8.34 | 0.01 | -0.865 |
| 2 | 894 | inh | inh | 0.01 | -52.9 | 0.01 | -0.966 |
| 3 | 831 | inh | exc | 0.03 | 2.46 | 0.03 | -0.563 |
| 4 | 902 | inh | inh | 0.01 | -59.7 | 0.01 | -0.977 |
| 5 | 897 | inh | inh | 0.01 | -59.3 | 0.01 | -0.979 |
| 6 | 928 | inh | inh | 0.01 | -62.6 | 0.01 | -0.97 |
| 7 | 914 | inh | inh | 0.01 | -27 | 0.01 | -0.972 |
| 8 | 829 | inh | inh | 0.01 | -17.2 | 0.01 | -0.932 |
| 9 | 908 | inh | inh | 0.01 | -89.6 | 0.01 | -0.873 |
| 10 | 922 | inh | inh | 0.01 | -45.9 | 0.01 | -0.784 |
Aha, the correlations are all negative.
And they were all positive for the exc inputs. So this is a better exc-or-inh decider.
And same performance, voila :)
Now for unconnected inputs.
df = tn[tn.real_type .== :unconn, :];
corrs = Float64[]
pvals = Float64[]
predtypes = Symbol[]
@showprogress for m in df.input_neuron_ID
    corr = cor(calc_STA(m,n,s,p), avgSTA)
    if (corr > 0) test_statistic(STA) = cor(STA, avgSTA)
    else          test_statistic(STA) = -cor(STA, avgSTA) end
    pval = test_connection(v, s.spike_times[m], p, test_statistic)
    if (pval ≥ 0.05)     predtype = :unconn
    elseif (corr > 0)    predtype = :exc
    else                 predtype = :inh end
    push!(pvals, pval)
    push!(corrs, corr)
    push!(predtypes, predtype)
end;
Progress: 100%|█████████████████████████████████████████| Time: 0:00:41
ENV["LINES"] = 100;
ENV["COLUMNS"] = 200;
df.predtype_corr = predtypes
df.pval_with_template_corr = pvals
df.corrs_with_template = corrs
df
40 rows × 8 columns
| input_neuron_ID | real_type | predicted_type | pval | area_over_start | predtype_corr | pval_with_template_corr | corrs_with_template | |
|---|---|---|---|---|---|---|---|---|
| Int64 | Symbol | Symbol | Float64 | Float64 | Symbol | Float64 | Float64 | |
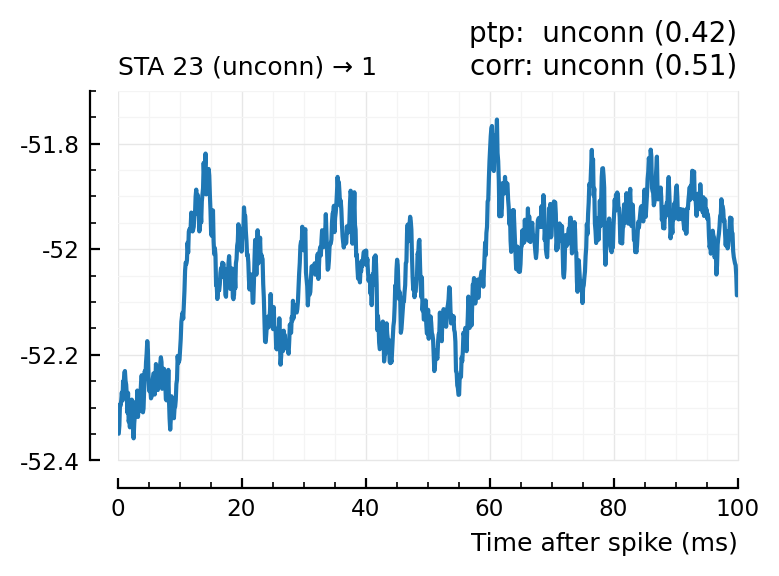
| 1 | 23 | unconn | unconn | 0.42 | 31.2 | unconn | 0.51 | 0.0247 |
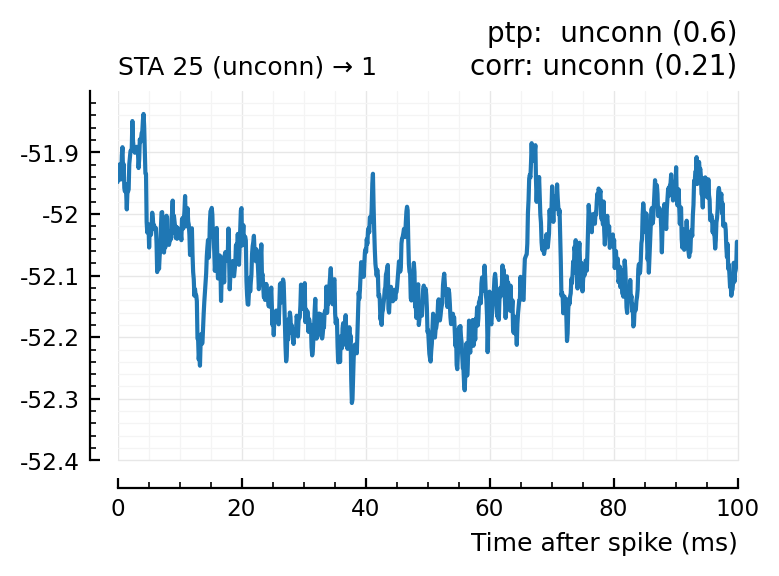
| 2 | 25 | unconn | unconn | 0.6 | -13.3 | unconn | 0.21 | -0.203 |
| 3 | 86 | unconn | unconn | 0.33 | -11.2 | unconn | 0.32 | 0.121 |
| 4 | 113 | unconn | unconn | 0.64 | -11 | unconn | 0.17 | -0.385 |
| 5 | 197 | unconn | unconn | 0.65 | 1.15 | unconn | 0.1 | 0.416 |
| 6 | 227 | unconn | unconn | 0.95 | 9.94 | unconn | 0.2 | 0.336 |
| 7 | 230 | unconn | unconn | 0.39 | 7.05 | unconn | 0.2 | -0.281 |
| 8 | 262 | unconn | unconn | 0.07 | 9.06 | unconn | 0.39 | -0.0677 |
| 9 | 269 | unconn | unconn | 0.45 | 6.56 | unconn | 0.27 | 0.195 |
| 10 | 323 | unconn | unconn | 0.4 | 3.37 | unconn | 0.22 | 0.317 |
| 11 | 332 | unconn | unconn | 0.88 | 0.694 | unconn | 0.42 | 0.0811 |
| 12 | 367 | unconn | exc | 0.02 | 2.77 | inh | 0.01 | -0.613 |
| 13 | 394 | unconn | unconn | 1 | -6.72 | unconn | 0.12 | 0.391 |
| 14 | 410 | unconn | unconn | 0.7 | 3.76 | unconn | 0.24 | 0.145 |
| 15 | 424 | unconn | unconn | 0.22 | 21.4 | unconn | 0.29 | 0.119 |
| 16 | 439 | unconn | unconn | 0.08 | -57.6 | unconn | 0.2 | 0.319 |
| 17 | 460 | unconn | unconn | 0.08 | 21.5 | exc | 0.04 | 0.591 |
| 18 | 487 | unconn | unconn | 0.32 | -7.35 | unconn | 0.42 | -0.0949 |
| 19 | 499 | unconn | exc | 0.01 | 2.17 | inh | 0.02 | -0.638 |
| 20 | 521 | unconn | unconn | 0.37 | 5.41 | unconn | 0.38 | 0.0533 |
| 21 | 537 | unconn | unconn | 0.22 | -2.49 | unconn | 0.12 | 0.381 |
| 22 | 547 | unconn | inh | 0.04 | -18.2 | unconn | 0.43 | -0.097 |
| 23 | 599 | unconn | unconn | 0.15 | -10.6 | exc | 0.03 | 0.634 |
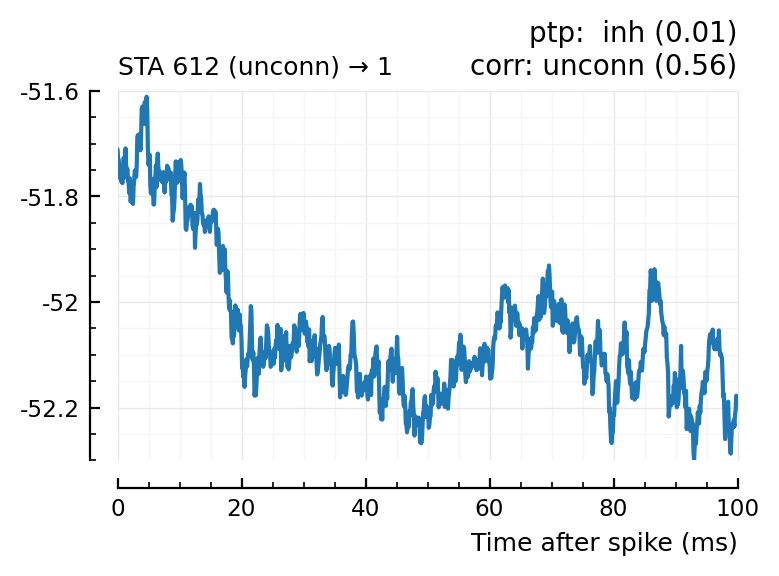
| 24 | 612 | unconn | inh | 0.01 | -34.3 | unconn | 0.56 | 0.0091 |
| 25 | 646 | unconn | unconn | 0.39 | -1.08 | unconn | 0.44 | 0.0809 |
| 26 | 669 | unconn | unconn | 0.27 | -20 | unconn | 0.21 | 0.262 |
| 27 | 702 | unconn | unconn | 0.49 | -21 | unconn | 0.45 | -0.0646 |
| 28 | 722 | unconn | unconn | 0.52 | -5.28 | unconn | 0.26 | -0.217 |
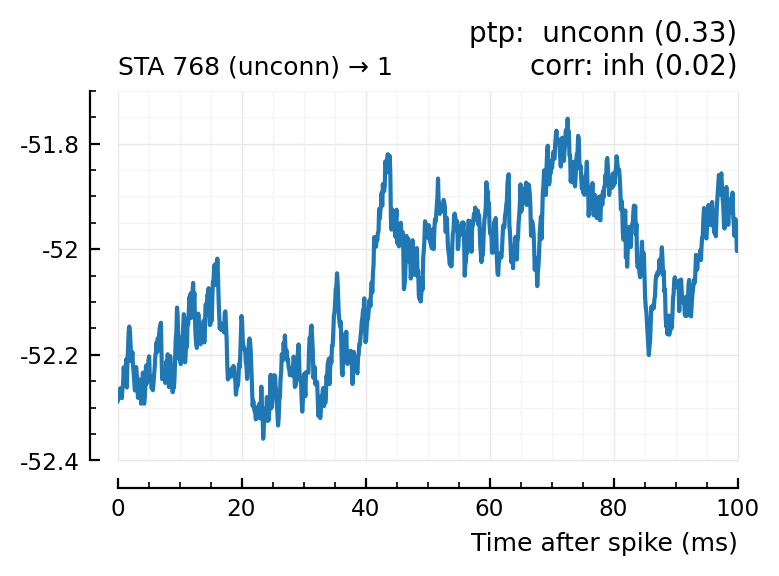
| 29 | 768 | unconn | unconn | 0.33 | 22.8 | inh | 0.02 | -0.613 |
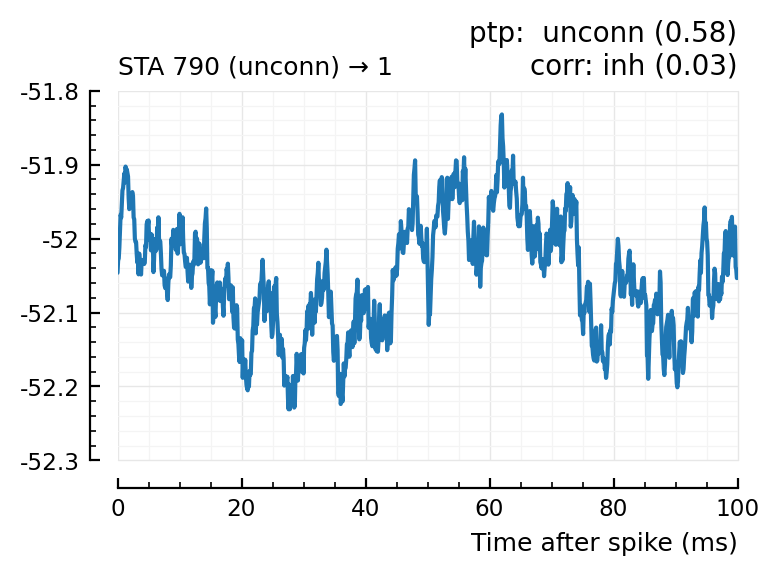
| 30 | 790 | unconn | unconn | 0.58 | -0.542 | inh | 0.03 | -0.52 |
| 31 | 813 | unconn | unconn | 0.46 | -23.2 | unconn | 0.07 | 0.488 |
| 32 | 821 | unconn | unconn | 0.5 | -3.52 | unconn | 0.14 | -0.357 |
| 33 | 842 | unconn | unconn | 0.08 | 6.56 | unconn | 0.11 | -0.417 |
| 34 | 843 | unconn | unconn | 0.27 | 10.1 | unconn | 0.14 | -0.333 |
| 35 | 875 | unconn | unconn | 0.49 | -47.3 | unconn | 0.21 | -0.339 |
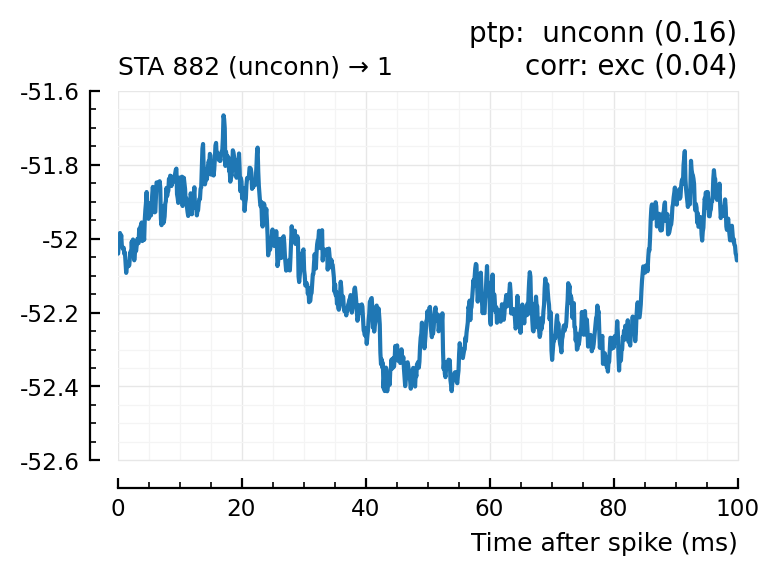
| 36 | 882 | unconn | unconn | 0.16 | -5.13 | exc | 0.04 | 0.53 |
| 37 | 896 | unconn | unconn | 0.86 | -20.6 | unconn | 0.35 | -0.0805 |
| 38 | 921 | unconn | unconn | 0.88 | -3.81 | unconn | 0.11 | 0.433 |
| 39 | 956 | unconn | unconn | 0.7 | -10.5 | unconn | 0.11 | 0.396 |
| 40 | 977 | unconn | exc | 0.04 | 21.7 | unconn | 0.39 | -0.091 |
WARNING: both Plot and PyPlot export "plot"; uses of it in module Main must be qualified
FPR__ptp = count(df.pval .< 0.05) / nrow(df)
0.125
FPR__template_match = count(df.pval_with_template_corr .< 0.05) / nrow(df)
0.125
So no change in the FPR (at α 0.05 at least).
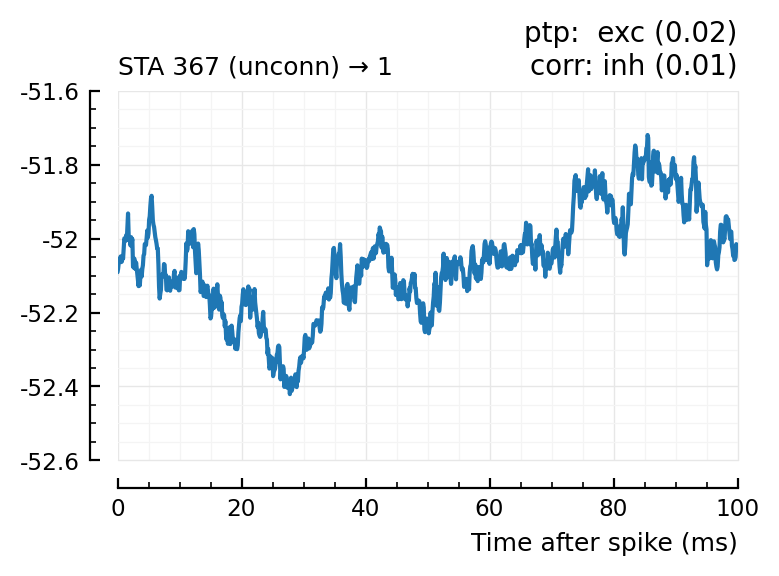
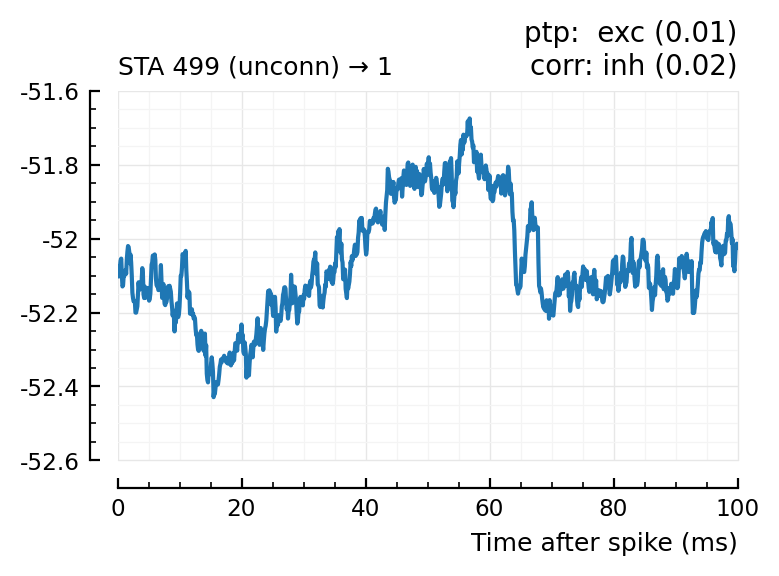
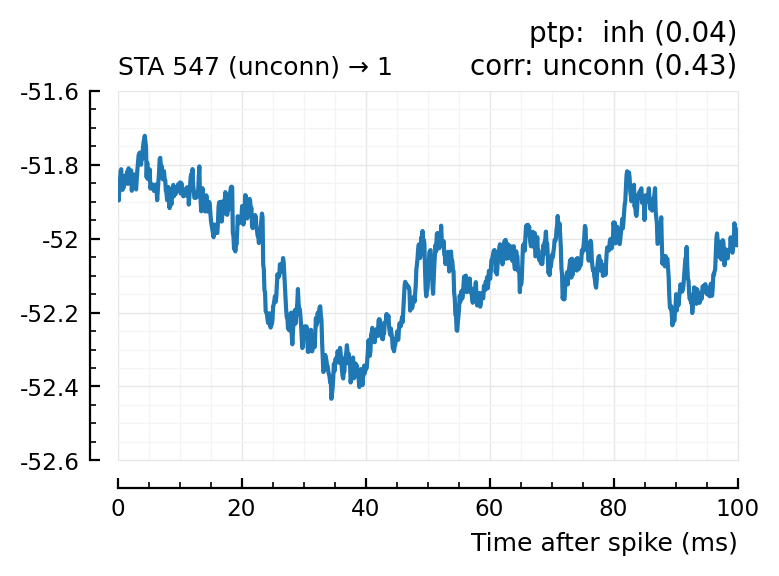
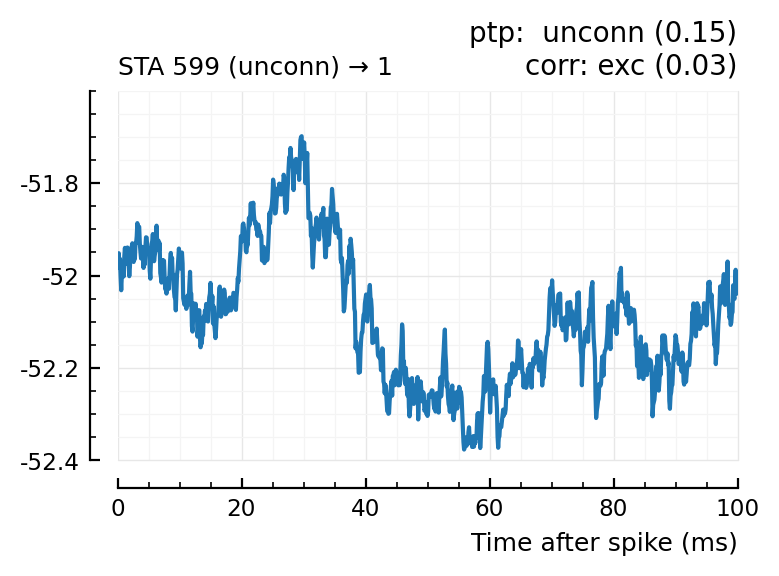
Plot the interesting cases where predictions differ.
function plotcase(m)
    row = first(df[df.input_neuron_ID .== m, :])
    title = jn("ptp:  $(row.predicted_type) ($(row.pval))",
               "corr: $(row.predtype_corr) ($(row.pval_with_template_corr))")
    plotSTA(m,n,s,p, hylabel="STA $m (unconn) → $n"; title)
end
for m in df[(df.predicted_type .!= :unconn) .| (df.predtype_corr .!= :unconn), :].input_neuron_ID
    plotcase(m)
end
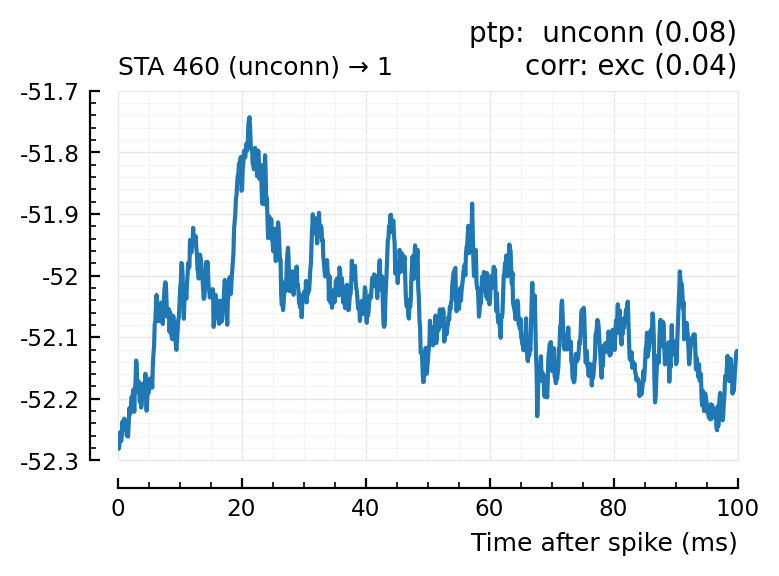
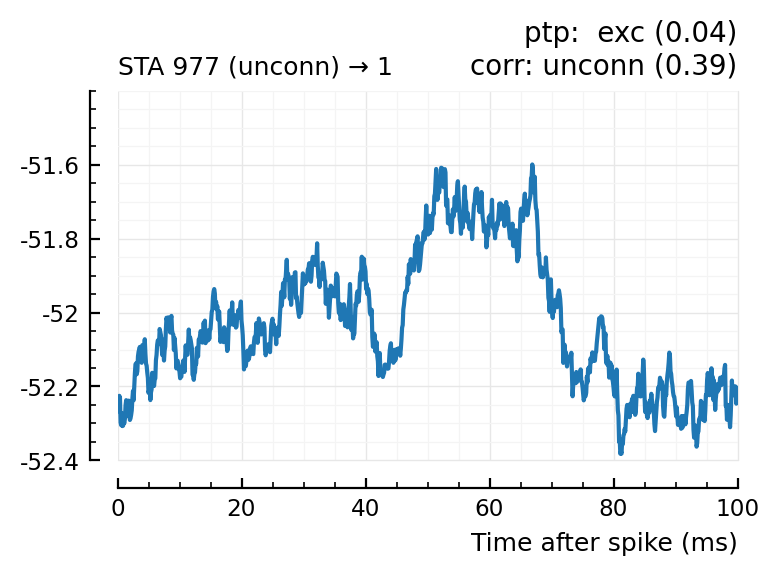
(For comparison, some clearly unconnecteds):
plotcase(23);
plotcase(25);
Now, apply this to all recorded postsynaptic neurons.
For that, we’ll add this connection test (and connection type test) to our codebase.
Copy-and-edit from codebase
(These functions use external var avgSTA).
# Renaming some existing funcs
STA_shuffle_test             = VoltoMapSim.test_connection
test_conn_using_ptp_and_area = VoltoMapSim.test_connection_and_type;
function test_conn_using_corr(v, spikes, p::ExpParams)
    @unpack α = p.evaluation
    STA = calc_STA(v, spikes, p)
    corr = cor(STA, avgSTA)
    if (corr > 0) test_stat = STA -> cor(STA, avgSTA)
    else          test_stat = STA -> -cor(STA, avgSTA) end
        # have to use anonymous funcs here: https://stackoverflow.com/a/65660721/2611913
    pval = STA_shuffle_test(v, spikes, p, test_stat)
    if     (pval ≥ α)  predtype = :unconn
    elseif (corr > 0)  predtype = :exc
    else               predtype = :inh end
    return predtype, (; pval, corr)
end;
function evaluate_conntest_perf_v3(s, m, p::ExperimentParams, verbose = true, testfunc = test_conn_using_ptp_and_area)
    # s = augmented simdata
    # m = postsynaptic neuron ID
    # testfunc is a function taking (voltage, spikes, p) and
    #   returning (predicted_type::Symbol, extra_info::NamedTuple)
    @unpack N_tested_presyn, rngseed = p.evaluation;
    resetrng!(rngseed)
    function get_IDs_labels(IDs, label)
        # Example output: `[(3, :exc), (5, :exc), (12, :exc), …]`.
        N = min(length(IDs), N_tested_presyn)
        IDs_sample = sample(IDs, N, replace = false, ordered = true)
        return zip(IDs_sample, fill(label, N))
    end
    ii = s.input_info[m]
    IDs_labels = chain(
        get_IDs_labels(ii.exc_inputs, :exc),
        get_IDs_labels(ii.inh_inputs, :inh),
        get_IDs_labels(ii.unconnected_neurons, :unconn),
    ) |> collect
    tested_neurons = DataFrame(
        input_neuron_ID = Int[],     # global ID
        real_type       = Symbol[],  # :unconn, :exc, :inh
        predicted_type  = Symbol[],  # idem
    )
    extra_infos = []
    N = length(IDs_labels)
    pbar = Progress(N, desc = "Testing connections: ", enabled = verbose, dt = 400ms)
    for (n, label) in IDs_labels
        predtype, extra_info = testfunc(ii.v, s.spike_times[n], p)
        row = (
            input_neuron_ID = n,
            real_type       = label,
            predicted_type  = predtype,
        )
        push!(tested_neurons, Dict(pairs(row)))
        push!(extra_infos, extra_info)
        next!(pbar)
    end
    tn = tested_neurons
    # Add `extra_info` columns to table
    colnames = keys(first(extra_infos))
    for colname in colnames
        tn[!, colname] = [tup[colname] for tup in extra_infos]
    end
    # Calculate detection rates (false positive and true positive rates)
    det_rate(t) = count((tn.real_type .== t) .& (tn.predicted_type .== t)) / count(tn.real_type .== t)
    detection_rates = (
        TPR_exc = det_rate(:exc),
        TPR_inh = det_rate(:inh),
        FPR = 1 - det_rate(:unconn),
    )
    return perf = (; tested_neurons, detection_rates)
end

cached_conntest_eval_v3(s, m, p; verbose = true, testfunc = test_conn_using_ptp_and_area) =
    cached(evaluate_conntest_perf_v3, [s, m, p, verbose, testfunc]; key = [m, p, string(testfunc)], verbose);
perf = cached_conntest_eval_v3(s, 1, p; testfunc = test_conn_using_corr)
perf.detection_rates
Testing connections: 100%|██████████████████████████████| Time: 0:00:31
Saving output at `C:\Users\tfiers\.phdcache\datamodel v2 (net)\evaluate_conntest_perf_v3\a17be8fa72748bbc.jld2` … done (6.2 s)
(TPR_exc = 0.885, TPR_inh = 1, FPR = 0.125)
# evaluate_conntest_perf_v3(s, 1, p, true, test_conn_using_corr)
Cool, works (and we now get our final improvement for neuron 1, with the new exc/inh decider too).
Peak-to-peak and area performance (from above):
(TPR_exc = 0.615, TPR_inh = 0.9, FPR = 0.125)
Now apply to all 50 recorded postsynaptic neurons
Conntest all recorded neurons
using Base.Threads
detrates_corr = Dict()
recorded_neurons = p.sim.network.record_v
pbar = Progress(length(recorded_neurons))
@threads for m in recorded_neurons
    perf = cached_conntest_eval_v3(s, m, p, verbose = false, testfunc = test_conn_using_corr)
    detrates_corr[m] = perf.detection_rates
    next!(pbar)
end
Progress: 100%|█████████████████████████████████████████| Time: 0:12:39
(Time taken: ~13 minutes).
function statstable(funcs, df; funcnames = string.(funcs), print = true, funcs_are_rows = true)
    # Apply each function in `funcs` to each column of the given DataFrame.
    statcols = [
        fname => [f(col) for col in eachcol(df)]
        for (f, fname) in zip(funcs, funcnames)
    ]
    df = DataFrame("" => names(df), statcols...)
    if (funcs_are_rows) df = permutedims(df, 1) end
    if print
        printsimple(df, formatters = ft_printf("%.2f"), alignment = :r)
        println()
    end
    return df
end;
to_df(detrates::Dict, ids) = DataFrame([detrates[n] for n in ids])

title(groupname, ids) = "Detection rates for $groupname neurons (n = $(length(ids)))"

detrate_distplot(detrates::DataFrame, hylabel) = ydistplot(
    "Exc. inputs" => detrates.TPR_exc,
    "Inh. inputs" => detrates.TPR_inh,
    "Unconn."     => detrates.FPR;
    ylim = [0,1],
    hylabel,
    ref = p.evaluation.α,
)
detrate_distplot(detrates, ids, groupname) = detrate_distplot(to_df(detrates, ids), title(groupname, ids))

function table(detrates, ids, groupname)
    println("\n", title(groupname, ids), ":", "\n")
    statstable([mean, median], to_df(detrates, ids))
    println("\n")
end;

function call_for_both(f, detrates)
    f(detrates, exc_post, "excitatory")
    f(detrates, inh_post, "inhibitory")
end

detrate_distplots(detrates) = call_for_both(detrate_distplot, detrates)
tables(detrates)            = call_for_both(table, detrates);
exc_post = 1:40
inh_post = 801:810;
detrate_distplots(detrates_corr);
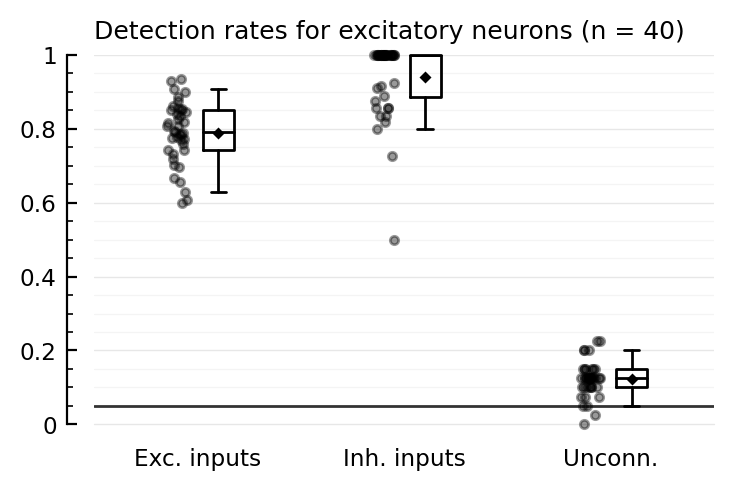
tables(detrates_corr);
Detection rates for excitatory neurons (n = 40):
TPR_exc TPR_inh FPR
────────────────────────────────
mean 0.79 0.94 0.12
median 0.79 1.00 0.12
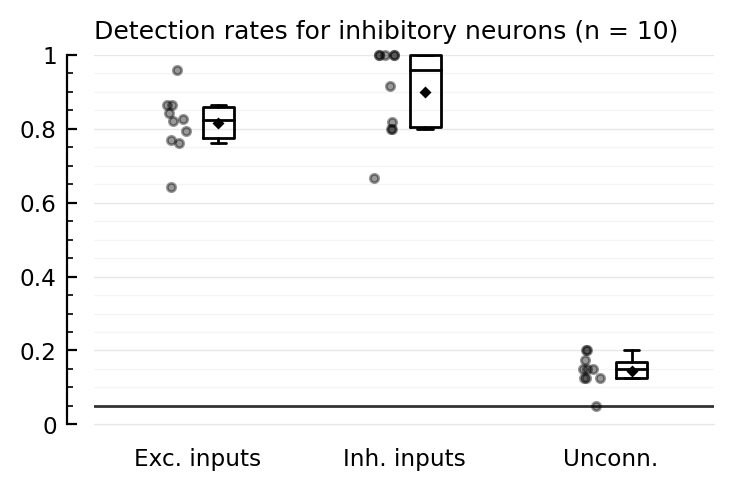
Detection rates for inhibitory neurons (n = 10):
TPR_exc TPR_inh FPR
────────────────────────────────
mean 0.81 0.90 0.15
median 0.82 0.96 0.15
(Could do a 95% confidence interval on e.g. median by bootstrap).
Compare with before (peak-to-peak & area-over-start)
detrates_ptp = Dict()
@showprogress for m in neurons
    perf = cached_conntest_eval(s, m, p, verbose = false)  # note: the previous eval func
    detrates_ptp[m] = perf.detection_rates
end
Progress: 100%|█████████████████████████████████████████| Time: 0:00:01
tables(detrates_ptp)
Detection rates for excitatory neurons (n = 40):

         TPR_exc  TPR_inh  FPR
────────────────────────────────
   mean     0.57     0.85  0.13
 median     0.57     0.88  0.12


Detection rates for inhibitory neurons (n = 10):

         TPR_exc  TPR_inh  FPR
────────────────────────────────
   mean     0.59     0.84  0.15
 median     0.57     0.81  0.15
Match with template but not using correlation; ref to start
ref_to_start(sig) = sig .- sig[1]
correspondence_with_template(STA) = mean(ref_to_start(STA) .* ref_to_start(avgSTA));
function test_conn_using_match_and_ref_to_start(v, spikes, p::ExpParams)
    @unpack α = p.evaluation
    STA = calc_STA(v, spikes, p)
    corr = correspondence_with_template(STA)
    if (corr > 0) test_stat = STA -> correspondence_with_template(STA)
    else          test_stat = STA -> -correspondence_with_template(STA) end
    pval = STA_shuffle_test(v, spikes, p, test_stat)
    if     (pval ≥ α)  predtype = :unconn
    elseif (corr > 0)  predtype = :exc
    else               predtype = :inh end
    return predtype, (; pval, corr_mV2 = corr / (mV^2))
end;
perf = cached_conntest_eval_v3(s, 1, p; testfunc = test_conn_using_match_and_ref_to_start)
perf.detection_rates
Testing connections: 100%|██████████████████████████████| Time: 0:00:30
Saving output at `C:\Users\tfiers\.phdcache\datamodel v2 (net)\evaluate_conntest_perf_v3\3d3e47c80c129767.jld2` … done
(TPR_exc = 0.769, TPR_inh = 0.9, FPR = 0.2)
Hah, so it works, but not as good as with correlation!
For all neurons:
detrates_startref = Dict()
pbar = Progress(length(recorded_neurons))
@threads for m in recorded_neurons
    perf = cached_conntest_eval_v3(s, m, p, verbose = false, testfunc = test_conn_using_match_and_ref_to_start)
    detrates_startref[m] = perf.detection_rates
    next!(pbar)
end
Progress: 100%|█████████████████████████████████████████| Time: 0:12:33
detrate_distplots(detrates_startref);
tables(detrates_startref);
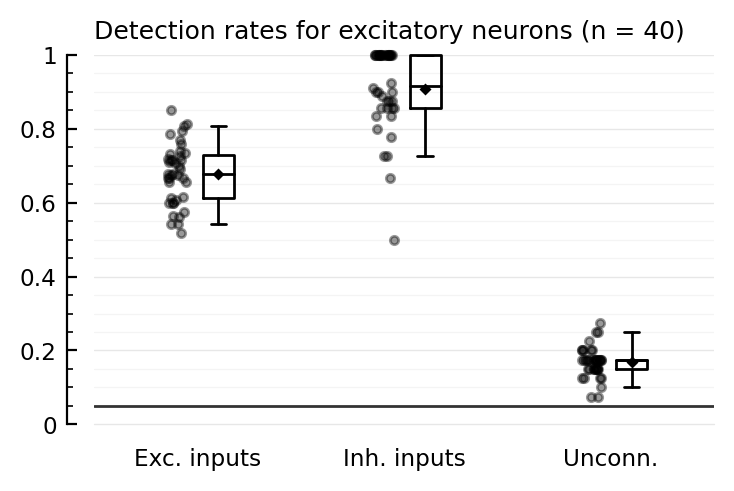
Detection rates for excitatory neurons (n = 40):
TPR_exc TPR_inh FPR
────────────────────────────────
mean 0.68 0.91 0.17
median 0.68 0.92 0.18
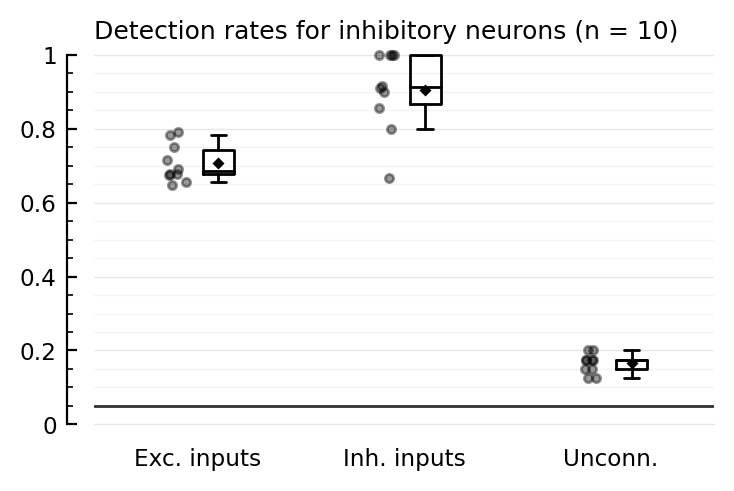
Detection rates for inhibitory neurons (n = 10):
TPR_exc TPR_inh FPR
────────────────────────────────
mean 0.71 0.90 0.16
median 0.69 0.91 0.18
Compare all three
We’ll take the median.
maindf = DataFrame(
    test_method = String[],
    postsyn_type = Symbol[],
    detrate_type = Symbol[],
    median = Float64[],
)
data = [
    "ptp-area"     => detrates_ptp,
    "corr"         => detrates_corr,
    "ref-to-start" => detrates_startref,
]
for (test_method, detrates) in data, postsyn_type in (:exc, :inh)
    group = (postsyn_type == :exc) ? exc_post : inh_post
    df = to_df(detrates, group)
    for (detrate_type, col) in pairs(eachcol(df))
        row = (; test_method, postsyn_type, detrate_type, median = median(col))
        push!(maindf, Dict(pairs(row)))
    end
end

df = copy(maindf)
sort!(df, [:detrate_type, :postsyn_type])
rename!(df, "postsyn_type" => "postsyn", "detrate_type" => "")
printsimple_(df) = printsimple(df, formatters = ft_printf("%.2f"), alignment = :r)
printsimple_(df);
 test_method   postsyn           median
────────────────────────────────────────
     ptp-area      exc      FPR    0.12
         corr      exc      FPR    0.12
 ref-to-start      exc      FPR    0.18
     ptp-area      inh      FPR    0.15
         corr      inh      FPR    0.15
 ref-to-start      inh      FPR    0.18
     ptp-area      exc  TPR_exc    0.57
         corr      exc  TPR_exc    0.79
 ref-to-start      exc  TPR_exc    0.68
     ptp-area      inh  TPR_exc    0.57
         corr      inh  TPR_exc    0.82
 ref-to-start      inh  TPR_exc    0.69
     ptp-area      exc  TPR_inh    0.88
         corr      exc  TPR_inh    1.00
 ref-to-start      exc  TPR_inh    0.92
     ptp-area      inh  TPR_inh    0.81
         corr      inh  TPR_inh    0.96
 ref-to-start      inh  TPR_inh    0.91
ptp-areais what we did before (peak-to-peak of STA, and area-over-start to decide whether exc or inh.corris correlation of STA with template (which is average E→E STA)ref-to-startis like corr, but usingmean(ref(STA) .* ref(avgSTA))whererefcenters around starting value (instead of around mean).
So:
regarding FPR,
corris no better or worse thanptp-area.ref-to-startis worse.for all TPRs,
ref-to-startis better than the previousptp-area, andcorris even better.
Filtering, widening, and sculpting the table to highlight the detection improvements:
using DataFramesMeta
df = @chain maindf begin
    @rsubset :test_method  != "ref-to-start"                # Only keep the cor method and the old method
    @rsubset string(:detrate_type) != "FPR"                 # Only keep TPRs
    unstack(:test_method, :median)                          # Widen: make new columns with given names and vals
    @rtransform! @astable begin
        :pre    = string(:detrate_type) |> s -> last(s, 3)  # Chop off "TPR_"
        :post   = string(:postsyn_type)
        :fromto = "$(:pre) → $(:post)"
    end
    sort!(:pre)
    select("fromto"=>"", "ptp-area"=>"before", "corr"=>"after")
end;
Summary
println("Median detection rate:\n")
printsimple_(df)
Median detection rate:

            before  after
──────────────────────────
 exc → exc    0.57   0.79
 exc → inh    0.57   0.82
 inh → exc    0.88   1.00
 inh → inh    0.81   0.96
(And median FPRs stay the same).
Significant improvement.
Still, 1 out of 5 exc inputs still not detected (before was 2 out of 5).
Looking at their STAs though (101 and 33 (here), and 132 (here above)), it makes sense they’re not detected: the STAs look like noise. Still, why do these inputs have a weaker STA?
Also, we’re still cheating (with avgSTA as template to correlate with). Now time to play fair and fit a func.
How much of improvement will remain :p