2020-12-30 • Test connection of all incoming neurons
Contents
2020-12-30 • Test connection of all incoming neurons
In the previous notebooks (/notebooks/2020-11-27__permutation_test and /notebooks/2020-11-30__speedup__spike_indices) we have tested the connection to the simulated neuron of just one of the 30 generated spike trains .
Here we test the connection of all spike trains.
Setup
from voltage_to_wiring_sim.support.notebook_init import *
Preloading:
 - numpy … (0.10 s)
 - matplotlib.pyplot … (0.22 s)
 - numba … (0.30 s)

Importing from submodules (compiling numba functions) … ✔

Imported `np`, `mpl`, `plt`
Imported codebase (`voltage_to_wiring_sim`) as `v`
Imported `*` from `v.support.units`
Setup autoreload
v.print_reproducibility_info()
This cell was last run by tfiers on yoga
on Wed 30 Dec 2020, at 18:16 (UTC+0100).
Last git commit (Wed 30 Dec 2020, 18:16).
No uncommitted changes
Simulation duration & timestep.
tg = v.TimeGrid(
    duration = 10 * minute,
    timestep = 0.1 * ms
);
A short time slice to visualise a zoomed in part of the generated signals.
zoom_range = 1 * minute + np.array([0, 1]) * second

zoom_range_indices = np.round(zoom_range / tg.timestep).astype(int)
i_zoom = slice(*zoom_range_indices)
t_zoom = tg.time[i_zoom];
1. Biology model
Spike trains
N_in = 30
p_connected = 0.5

N_connected = round(N_in * p_connected)
N_unconnected = N_in - N_connected
15
f_spike = 20 * Hz;
v.fix_rng_seed()
spike_trains_connected = [v.generate_Poisson_spikes(f_spike, tg.duration) for _ in range(N_connected)]
spike_trains_unconnected = [v.generate_Poisson_spikes(f_spike, tg.duration) for _ in range(N_unconnected)]
all_spike_trains = spike_trains_connected + spike_trains_unconnected
all_incoming_spikes = np.concatenate(spike_trains_connected);
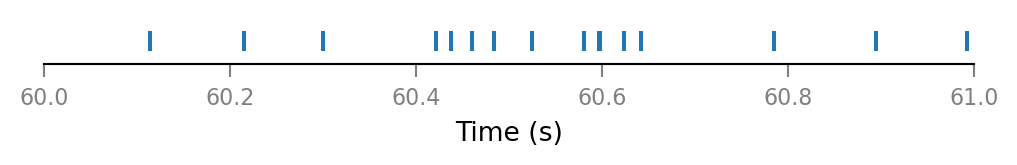
v.spike_trains.plot(all_spike_trains[0], zoom_range);
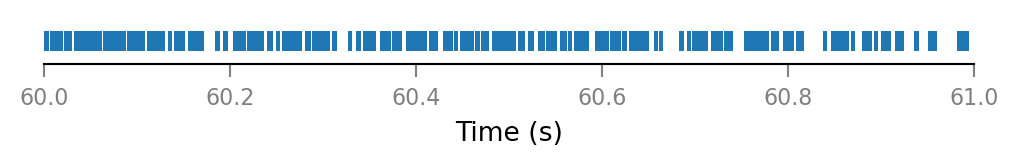
v.spike_trains.plot(all_incoming_spikes, zoom_range);
Synaptic conductance
Δg_syn = 0.8 * nS
τ_syn = 7 * ms;
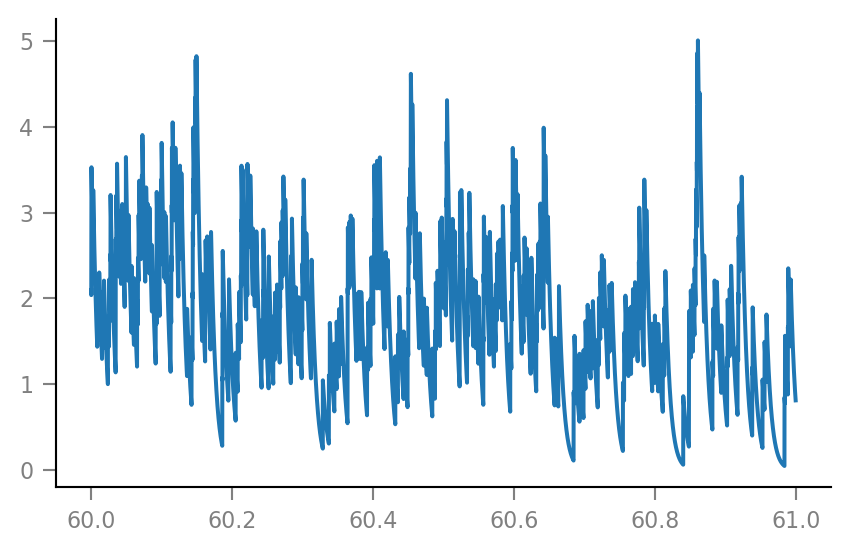
g_syn = v.calc_synaptic_conductance(tg, all_incoming_spikes, Δg_syn, τ_syn);
plt.plot(t_zoom / second, g_syn[i_zoom] / nS);
Membrane voltage
params = v.params.cortical_RS
v.pprint(params)
IzhikevichParams
----------------
     C = 1E-10
     k = 7E-07
   v_r = -0.06
   v_t = -0.04
v_peak = 0.035
     a = 30
     b = -2E-09
     c = -0.05
     d = 1E-10
 v_syn = 0
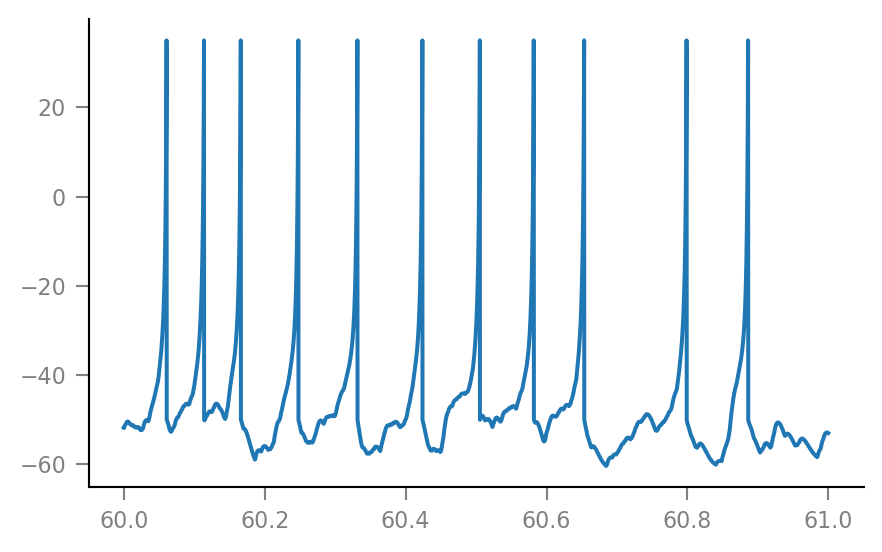
sim = v.simulate_izh_neuron(tg, params, g_syn);
plt.plot(t_zoom / second, sim.V_m[i_zoom] / mV);
2. Imaging model
VI_signal = v.add_VI_noise(sim.V_m, params);
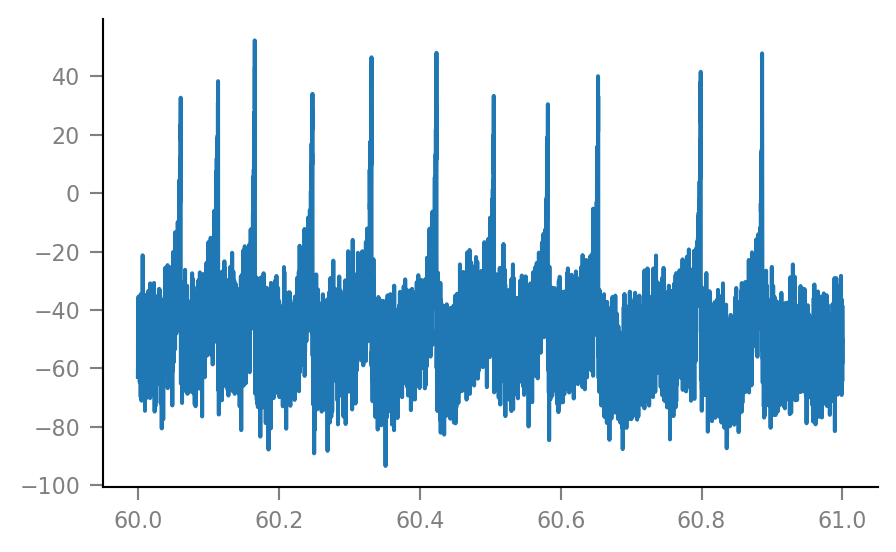
plt.plot(t_zoom / second, VI_signal[i_zoom] / mV);
3. Connection detection
Permutation test for each generated spike train (using height of average spike-triggered window as test statistic):
from tqdm.notebook import tqdm as time_loop

test_data, test_summaries = [], []

for spike_train in time_loop(all_spike_trains):
    test_data_, test_summary = (
        v.test_connection(
            spike_train,
            VI_signal,
            window_duration=100 * ms,
            num_shuffles=100
        )
    )
    test_data.append(test_data_)
    test_summaries.append(test_summary)
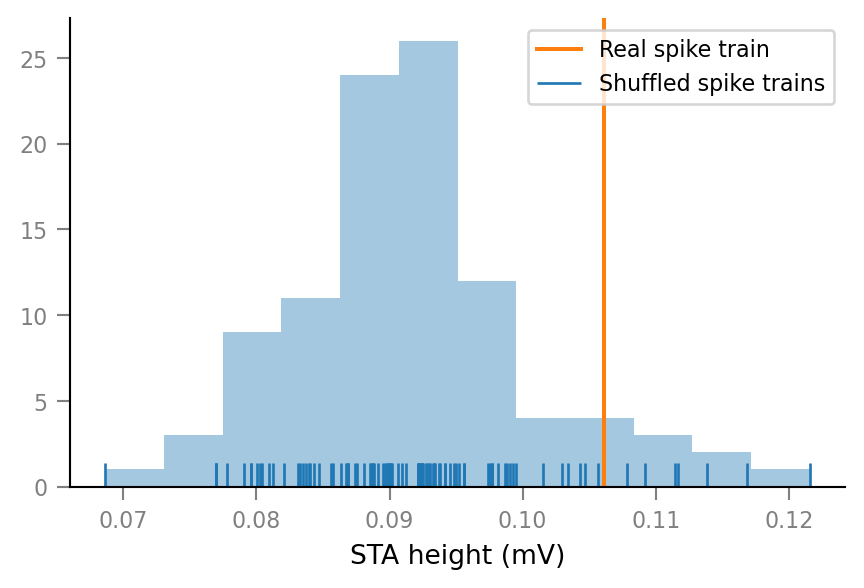
Example results
def show_test_results(spike_train_nr: int):
    v.connection_test.plot(test_data[spike_train_nr])
    v.pprint(test_summaries[spike_train_nr])
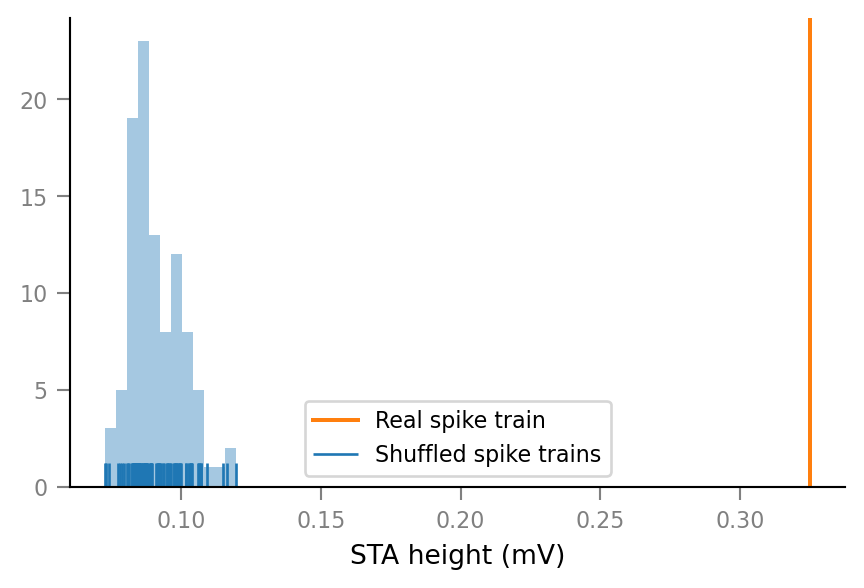
..for two connected neurons:
show_test_results(spike_train_nr=0)
ConnectionTestSummary
---------------------
            p_value = 0.01
       p_value_type = '<'
relative_STA_height = 3.565
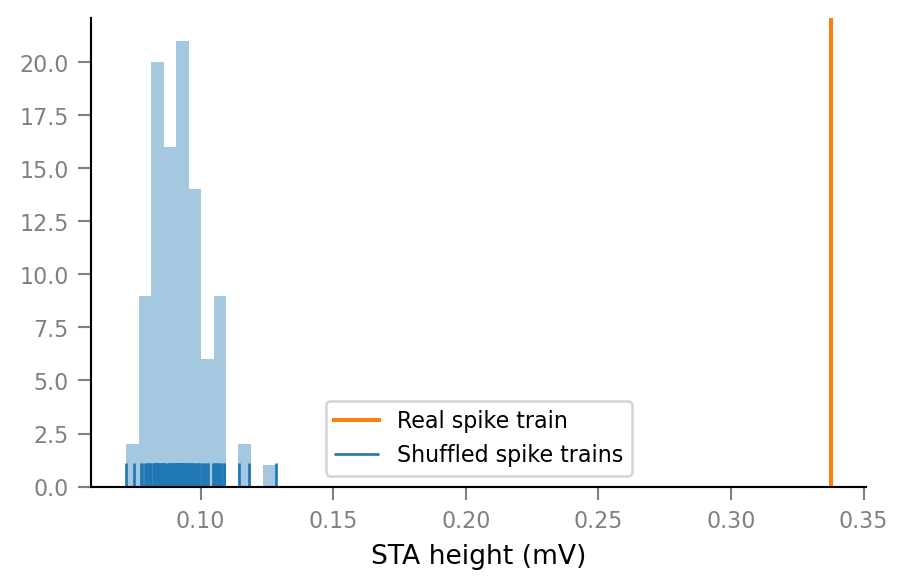
show_test_results(spike_train_nr=14)
ConnectionTestSummary
---------------------
            p_value = 0.01
       p_value_type = '<'
relative_STA_height = 3.663
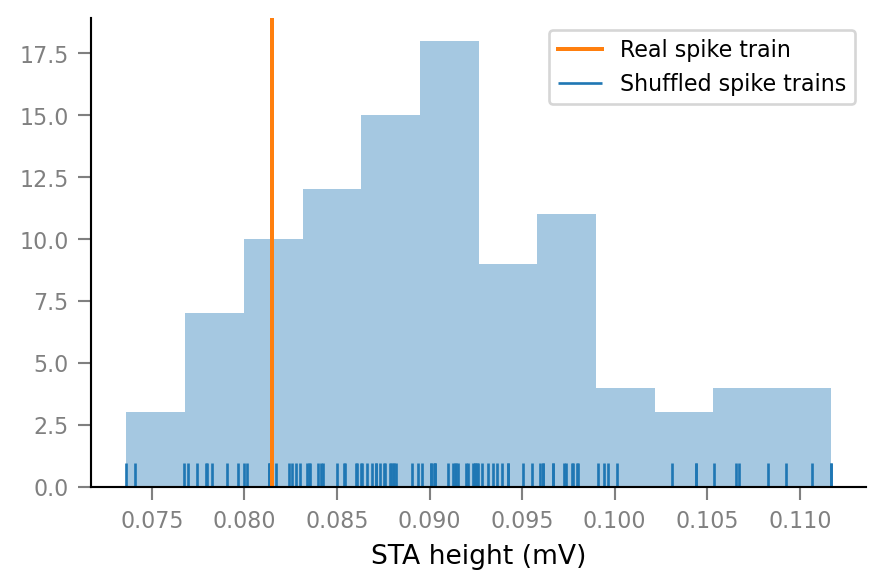
and an unconnected neuron:
show_test_results(spike_train_nr=15)
ConnectionTestSummary
---------------------
            p_value = 0.85
       p_value_type = '='
relative_STA_height = 0.8996
Note that “STA height” is defined as the difference between the maximum and the minimum of the average spike-triggered VI signal window.
Distribution of p-values
p_values = [test_summary.p_value for test_summary in test_summaries];
import seaborn as sns

ax = sns.distplot(p_values, kde=False, bins=100)
ax.set(xlabel="p-value", ylabel="nr. of spike trains")
ax.axvline(0.05, color='black', lw=0.5);
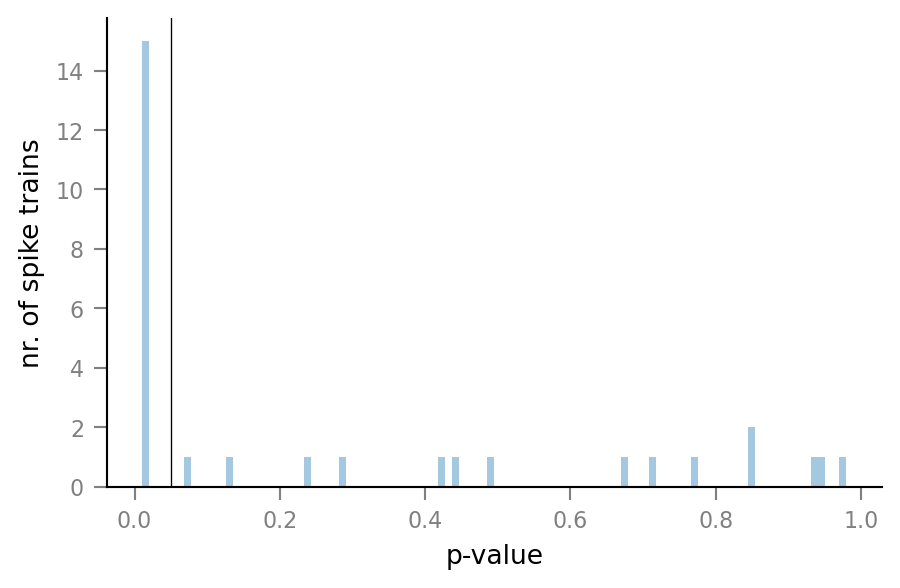
One unconnected spike train almost reaches the (arbitrary) p-value threshold of 0.05 for classification as being connected.
Which spike train is it?
min([(spike_train_nr, p_value)
     for spike_train_nr, p_value in enumerate(p_values)
     if p_value > 0.01],
    key=lambda tup: tup[1])
(20, 0.07)
show_test_results(spike_train_nr=20)
ConnectionTestSummary
---------------------
            p_value = 0.07
       p_value_type = '='
relative_STA_height = 1.156
Distribution of relative STA heights
relative_STA_height is defined as the height of the original spike train’s STA window divided by the mean height of the shuffled spike train’s STA windows. This is their distribution over the different connected & unconnected spike trains:
ax = sns.distplot([test_summary.relative_STA_height for test_summary in test_summaries],
                  kde=False, bins=30, rug=True)
ax.set(xlabel="Original vs shuffled STA height", ylabel="nr. of spike trains in bin");
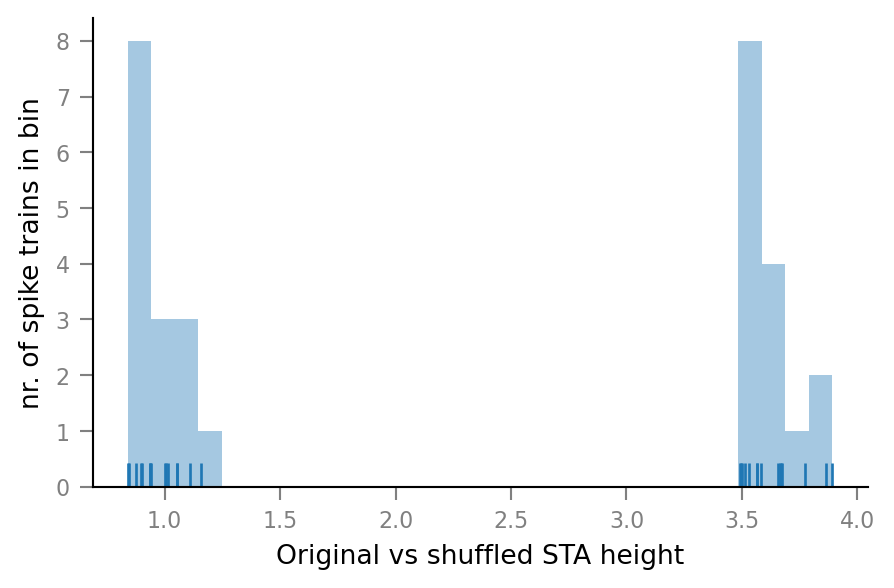
The connected & unconnected spike trains can be clearly separated.
Reproducibility info
v.print_reproducibility_info(verbose=True)
This cell was last run by tfiers on yoga
on Wed 30 Dec 2020, at 18:17 (UTC+0100).
Last git commit (Wed 30 Dec 2020, 18:16).
Uncommited changes to:
M notebooks/2020_12_30__test_all_connections.ipynb
Platform:
Windows-10
CPython 3.8.3 (C:\conda\python.exe)
Intel(R) Core(TM) i7-10510U CPU @ 1.80GHz
Dependencies of voltage_to_wiring_sim and their installed versions:
numpy                1.19.2
matplotlib           3.3.2
numba                0.51.2
seaborn              0.10.1
scipy                1.5.2
scikit-learn         0.23.2
preload              2.1
py-cpuinfo           7.0.0
nptyping             1.3.0
tqdm                 4.55.0