2022-08-29 • Visualizing subnets
Contents
2022-08-29 • Visualizing subnets
Params
Based on Roxin; same as previous nb’s.
d = 6
p = get_params(
    duration = 10minutes,
    p_conn = 0.04,
    g_EE = 1   / d,
    g_EI = 18  / d,
    g_IE = 36  / d,
    g_II = 31  / d,
    ext_current = Normal(-0.5 * pA/√seconds, 5 * pA/√seconds),
    E_inh = -80 * mV,
    record_v = [1, 801],
);
Connection stats
conn matrix is [from, to].
So one row is all outputs of one neuron.
Summing over cols i.e. dim two gives num outputs.
num_out = count(s.is_connected, dims=2)
num_in = vec(count(s.is_connected, dims=1));
using PyPlot
using VoltoMapSim.Plot
ydistplot("Num out" => num_out, "Num in" => num_in);
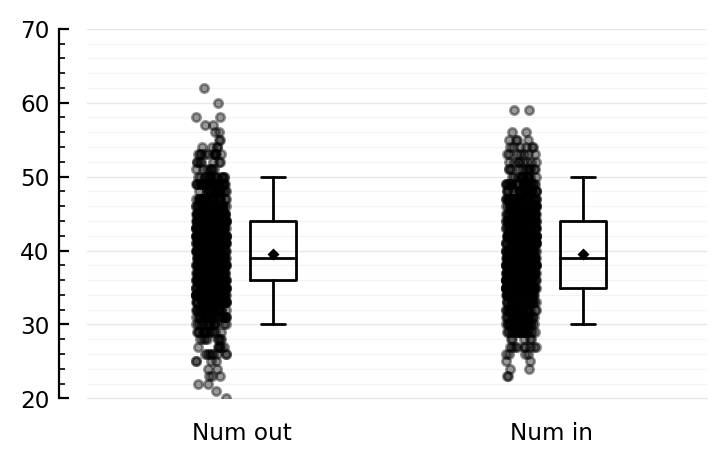
Sure yes, 40 = 1000 * 0.04.
Median is a bit lower than that as we post-hoc deleted the self connections.
Export & draw graphs
Let’s export to Graphviz dot, to explore viz options with Gephi.
lines = ["digraph {"]
for id in s.neuron_IDs
    outputs = join(s.output_neurons[id], ", ")
    type = s.neuron_type[id]
    push!(lines, "   $(id) [type = $(type)]")
    push!(lines, "   $(id) -> {$(outputs)}")
end
push!(lines, "}")
dot = join(lines, "\n")
lines[[1:5; end-2:end]]
8-element Vector{String}:
 "digraph {"
 "   1 [type = exc]"
 "   1 -> {9, 10, 13, 19, 35, 55," ⋯ 121 bytes ⋯ "832, 861, 917, 942, 967, 1000}"
 "   2 [type = exc]"
 "   2 -> {62, 70, 100, 127, 185," ⋯ 110 bytes ⋯ " 765, 831, 885, 893, 900, 930}"
 "   1000 [type = inh]"
 "   1000 -> {16, 23, 60, 148, 18" ⋯ 182 bytes ⋯ " 873, 885, 929, 955, 973, 976}"
 "}"
open(joinpath(homedir(), ".phdcache", "graph.dot"), "w") do io
    println(io, dot)
end
Nice! Graphviz, fun.
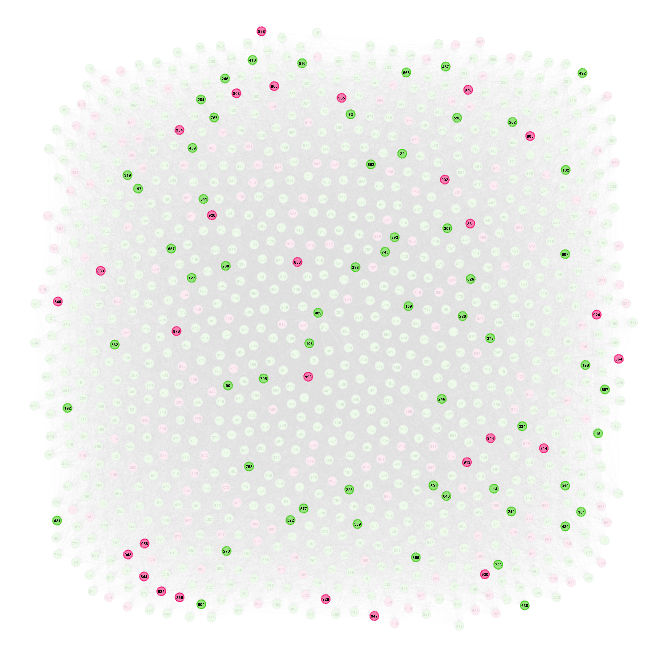
All 1000 neurons are drawn (inhibitory in red). The highlighted neurons are the inputs and outputs of one neuron.
Now I want only a subset of the net. Say: 1, 801, and their inputs and outputs.
lines = ["digraph {"]
for m in [1, 801]
    t = s.neuron_type[m]
    push!(lines, "   $m [type = $t]")
    for n in s.input_neurons[m]
        t = s.neuron_type[n]
        push!(lines, "   $n [type = $t]")
        push!(lines, "   $n -> $m")
    end
    for n in s.output_neurons[m]
        t = s.neuron_type[n]
        push!(lines, "   $n [type = $t]")
        push!(lines, "   $m -> $n")
    end
end
push!(lines, "}")
open(joinpath(homedir(), ".phdcache", "graph.dot"), "w") do io
    println(io, join(lines, "\n"))
end
Seems like gephi can’t handle {…} -> format alas. So all inputs on sep line.
(Yifan Hu layout with default settings)
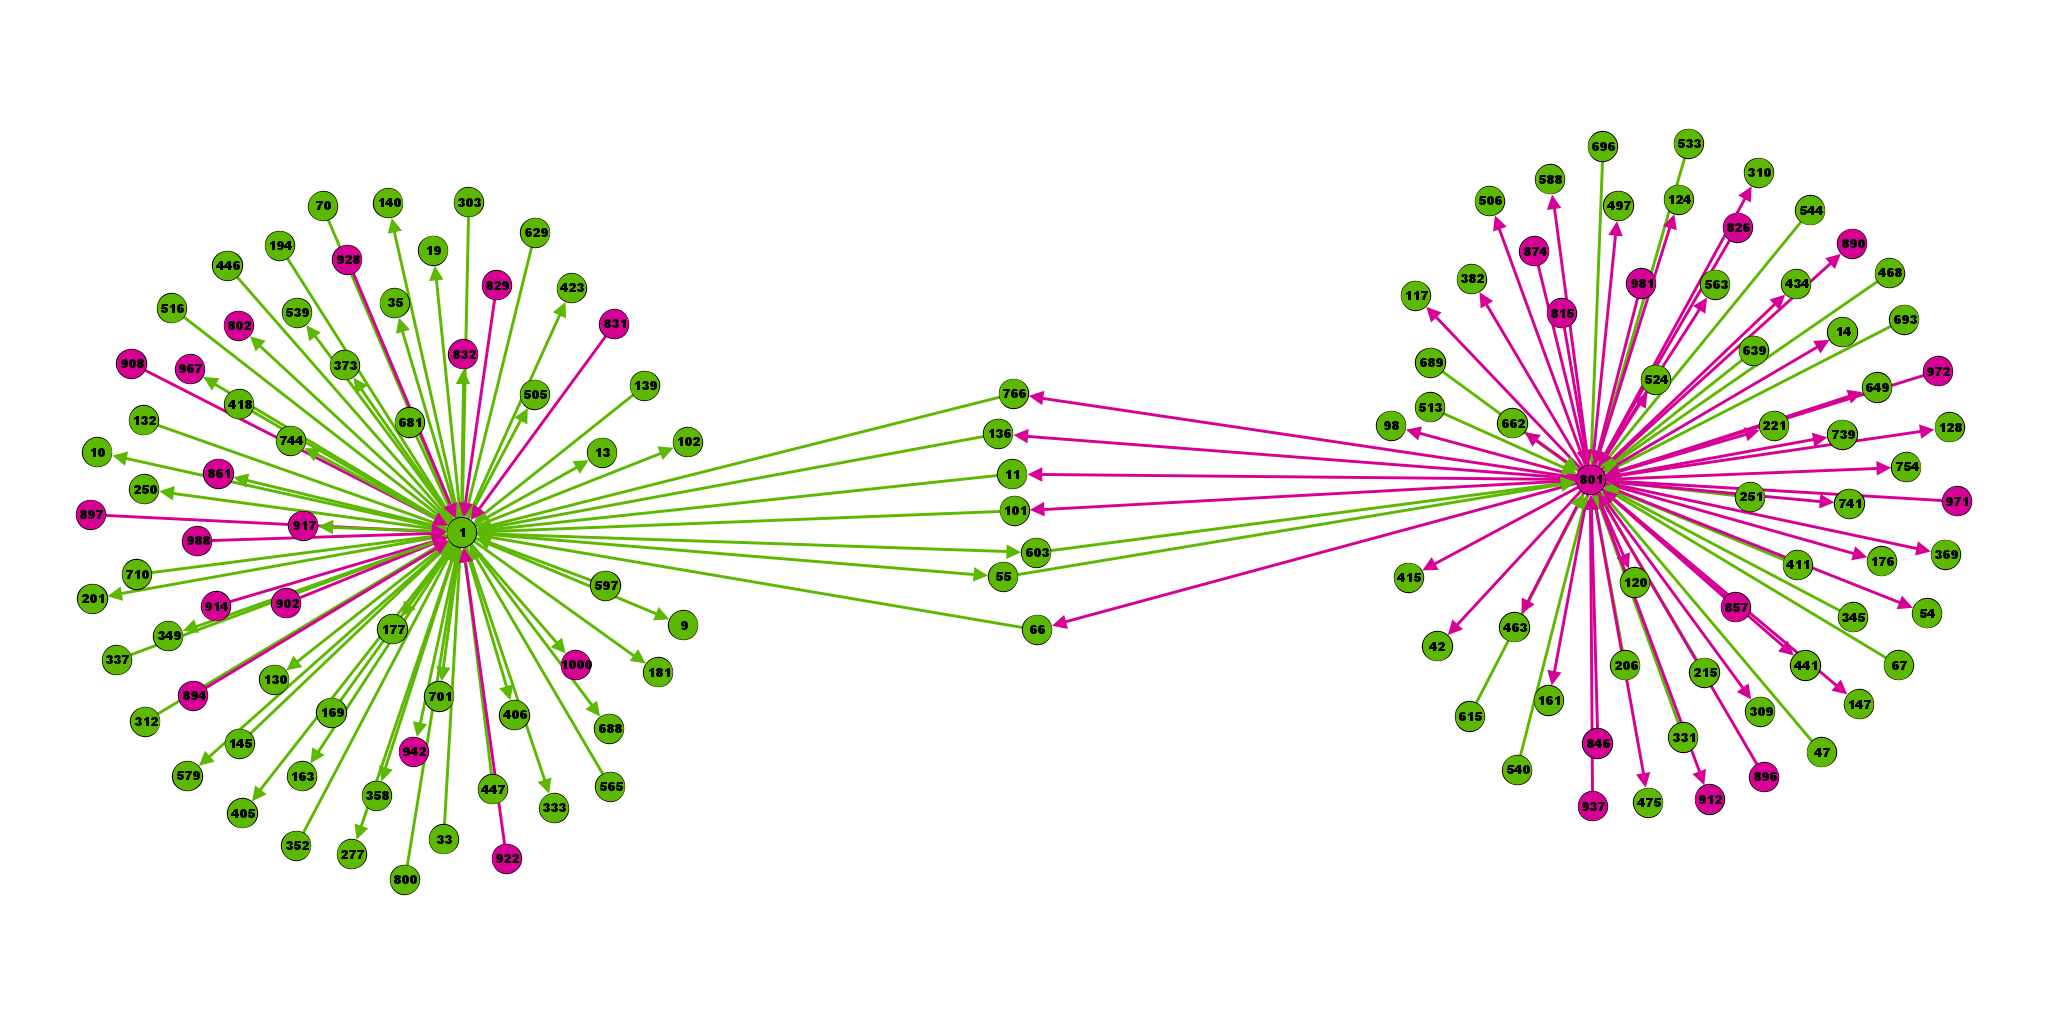
So these two random neurons have 7 disynaptic connections between them:
2 from the exc (1, left) to the inh (801, right); and 5 from the inh to the exc. All 7 pass through an excitatory neuron.
Same but using graphviz as layouter:

(Open in new tab to see full size).
Inputs only
Above has inputs and outputs. What if we export: inputs to both neurons, and inputs to these inputs.
I should have a function that does this the graphviz.dot file generation.. What’s its inputs. Let’s say (m => n) pairs.
function gen_dot_file(edges, s; dir=joinpath(homedir(), ".phdcache"), filename="graph.dot")
    nodes = Set()
    lines = ["digraph {"]  # DIrected graph
    for (m, n) in edges
        push!(nodes, m, n)
        push!(lines, "   $m -> $n")
    end
    for n in sort!(collect(nodes))
        t = s.neuron_type[n]
        c = (t == :exc) ? "#3fb17d" : "#ee7993"
        push!(lines, "   $n [type = $t, color = \"$c\"]")
    end
    push!(lines, "}")
    open(joinpath(dir, filename), "w") do io
        println(io, join(lines, "\n"))
    end
end;
edges = []
n = 1
for m in s.input_neurons[n]
    push!(edges, m => n)
    for l in s.input_neurons[m]
        push!(edges, l => m)
    end
end
gen_dot_file(edges, s)
This of just the inputs to the inputs of one neuron contains already 770 neurons, i.e. almost all 1000 of them. Visualizing it is not very helpful, except for showing that the direct inputs are strongly interconnected (Yifan Hu layout, default gephi params):
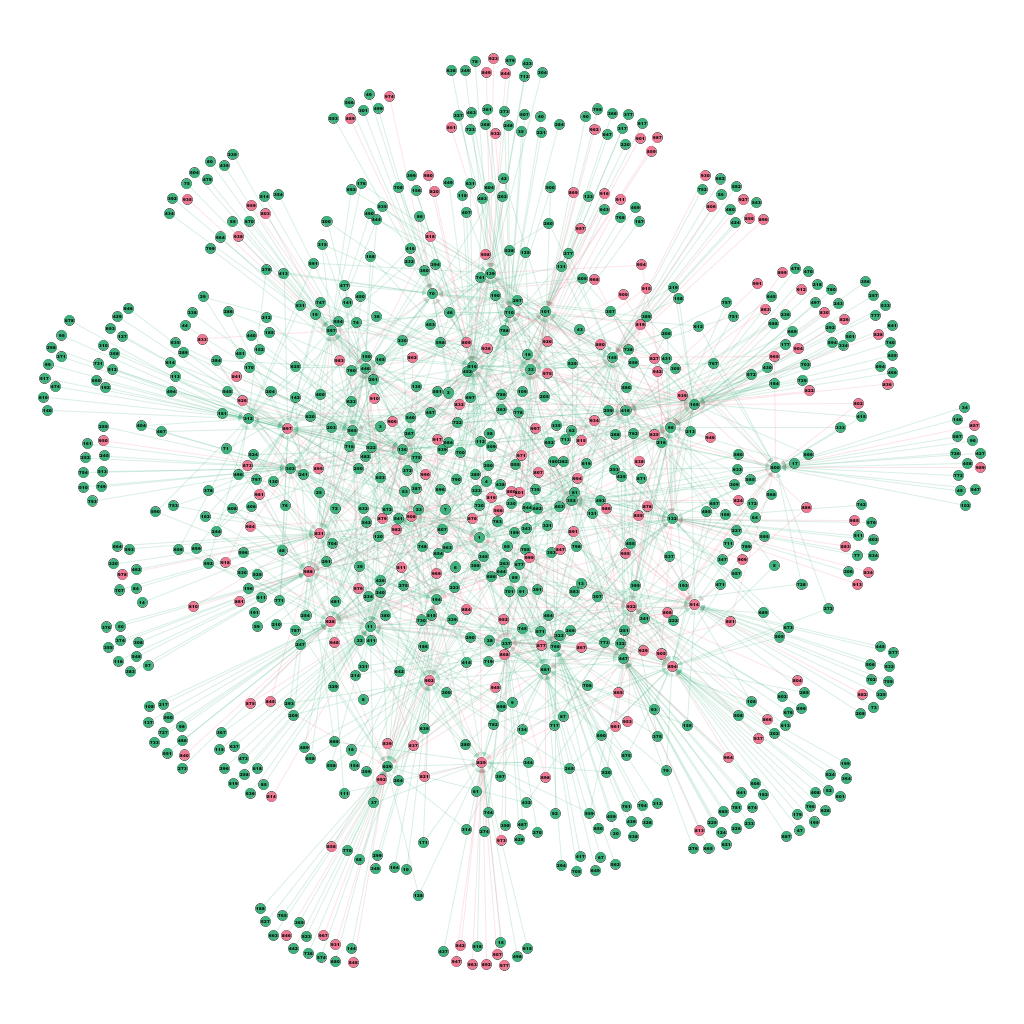
With direct inputs to neuron 1 highlighted:
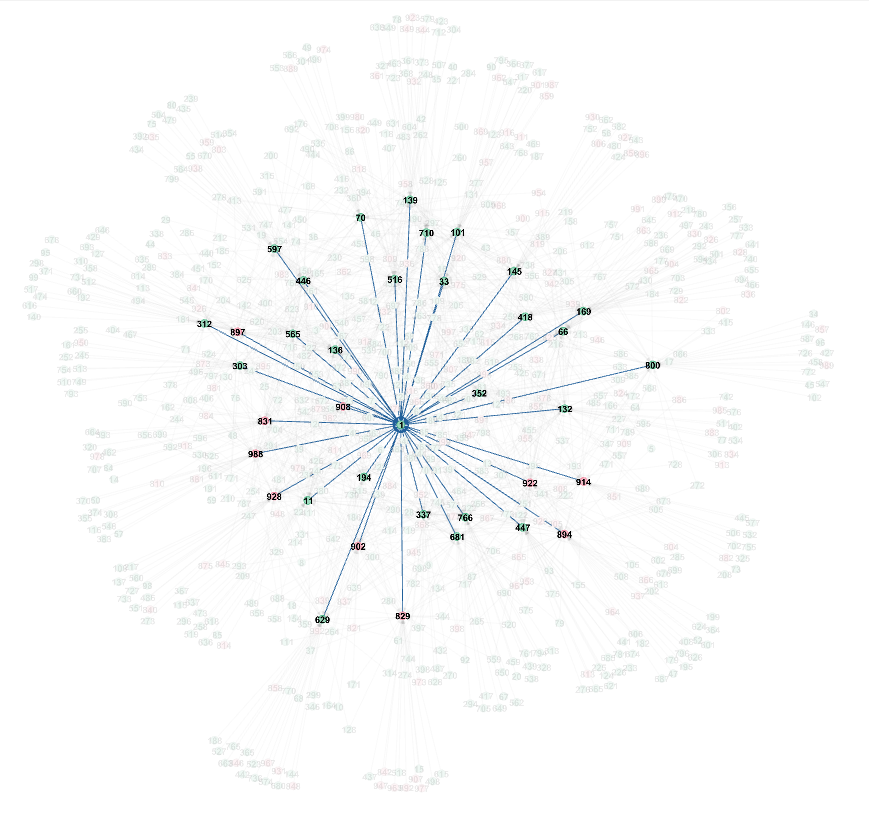
Most of the neurons in the tangle in the middle are neurons that connect to multiple (2 to 5) direct inputs of 1.