2022-09-01 • 1144 weights
Contents
2022-09-01 • 1144 weights
Params
d = 1
p = get_params(
    duration = 10minutes,
    p_conn = 0.04,
    g_EE = 1 / d,
    g_EI = 1 / d,
    g_IE = 4 / d,
    g_II = 4 / d,
    ext_current = Normal(-0.5 * pA/√seconds, 5 * pA/√seconds),
    E_inh = -80 * mV,
    record_v = [1:40; 801:810],
);
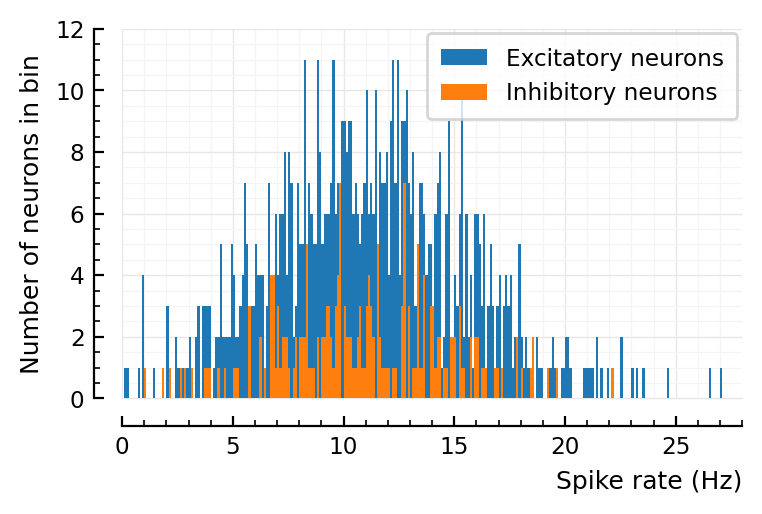
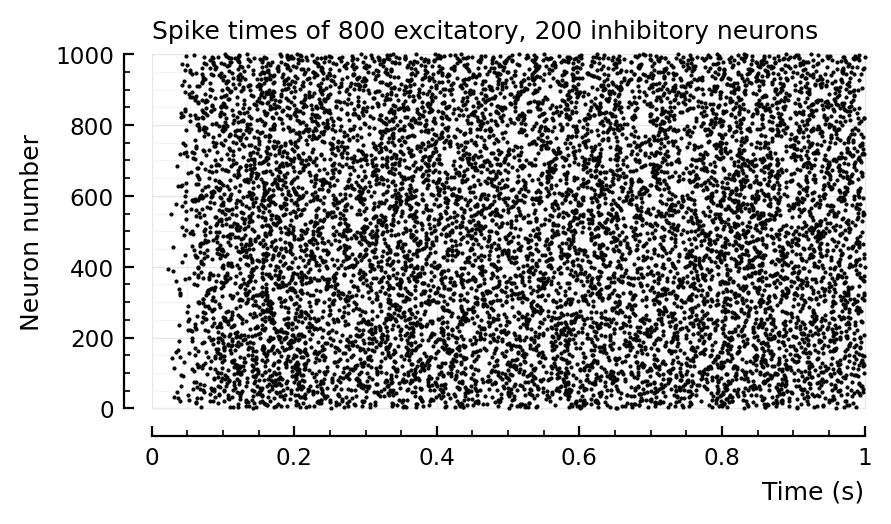
Plot firing rates
using PyPlot
using VoltoMapSim.Plot
histplot_fr(s.spike_rates);
rasterplot(s.spike_times, tlim=[0,1]);
Connection tests
(Using the new connection test and performance evaluation where we also predict exc or inh).
– though results for unconnected are unchanged, so we can still compare with previous mass-eval (2022-07-23__Record_many).
using Base.Threads
detrates = Dict()
neurons = p.sim.network.record_v
pbar = Progress(length(neurons))
@threads for m in neurons
    perf = cached_conntest_eval(s, m, p, verbose = false)
    detrates[m] = perf.detection_rates
    next!(pbar)
end
Progress:  58%|████████████████████████                 |  ETA: 0:00:00
Progress: 100%|█████████████████████████████████████████| Time: 0:00:00
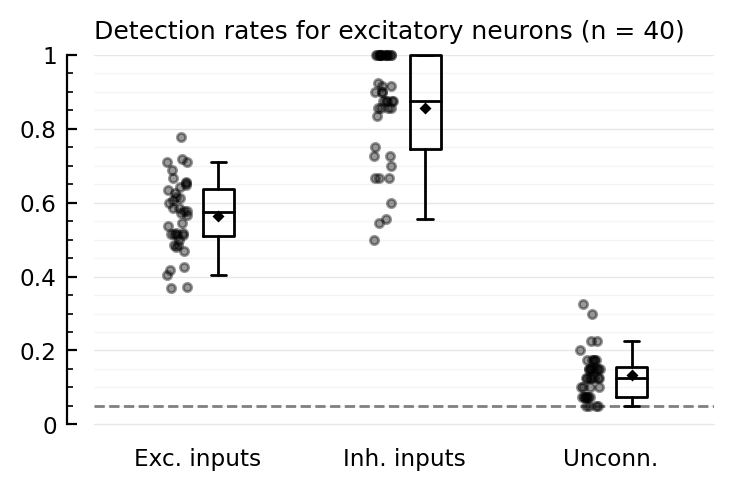
Plot perf
exc_post = [1:40;]
inh_post = [801:810;];
function detplot(ids, groupname)
    N = length(ids)
    ax = ydistplot(
        "Exc. inputs" => [detrates[n].TPR_exc for n in ids],
        "Inh. inputs" => [detrates[n].TPR_inh for n in ids],
        "Unconn." => [detrates[n].FPR for n in ids],
        ylim = [0,1],
        hylabel = "Detection rates for $(groupname) neurons (n = $N)",
        ref = p.evaluation.α,
    )
    return nothing
end;
detplot(exc_post, "excitatory")
detplot(inh_post, "inhibitory")
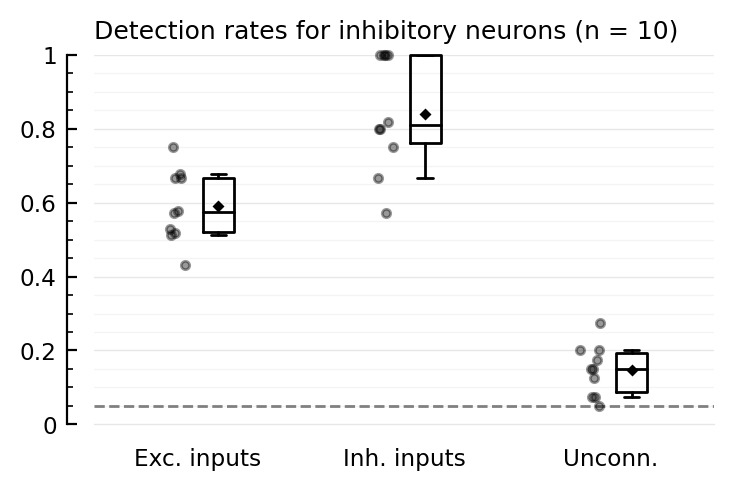
Interesting!
Higher-than-α FPR exists here too
E→E is detected here!
(compare with 2022-07-23 • Record many neurons, where E→E is not detected at all).
In 2022-05-13 • Network, we had (only for 1 neuron instead of 40) low E→E detectability, no I→E detectability, and lower than α FPR.
But that net had the mistaken ‘1414’ connection strength params (inh inputs 4x as strong, instead of outputs).
Inspect performance
m = 1
perf = cached_conntest_eval(s,m,p)
ENV["LINES"] = 100  # display all rows of table
perf.tested_neurons
76 rows × 5 columns
| input_neuron_ID | real_type | predicted_type | pval | area_over_start | |
|---|---|---|---|---|---|
| Int64 | Symbol | Symbol | Float64 | Float64 | |
| 1 | 139 | exc | exc | 0.01 | 17 |
| 2 | 681 | exc | inh | 0.01 | -4 |
| 3 | 11 | exc | exc | 0.01 | 18 |
| 4 | 766 | exc | exc | 0.01 | 52 |
| 5 | 132 | exc | exc | 0.03 | 18.5 |
| 6 | 516 | exc | exc | 0.01 | 30.4 |
| 7 | 418 | exc | inh | 0.01 | -3.7 |
| 8 | 565 | exc | unconn | 0.05 | 18.7 |
| 9 | 597 | exc | exc | 0.01 | 26.3 |
| 10 | 446 | exc | exc | 0.01 | 19.4 |
| 11 | 447 | exc | exc | 0.01 | 40.3 |
| 12 | 710 | exc | exc | 0.01 | 28.6 |
| 13 | 66 | exc | exc | 0.01 | 8.29 |
| 14 | 136 | exc | unconn | 0.09 | 5.45 |
| 15 | 312 | exc | exc | 0.01 | 82.6 |
| 16 | 145 | exc | inh | 0.01 | -27.8 |
| 17 | 169 | exc | exc | 0.01 | 50.6 |
| 18 | 194 | exc | unconn | 0.35 | -1.99 |
| 19 | 629 | exc | exc | 0.01 | 4.7 |
| 20 | 352 | exc | unconn | 0.82 | -8.92 |
| 21 | 800 | exc | unconn | 0.72 | -4.17 |
| 22 | 303 | exc | exc | 0.01 | 2.51 |
| 23 | 101 | exc | unconn | 0.29 | 21.1 |
| 24 | 70 | exc | exc | 0.01 | 16.9 |
| 25 | 337 | exc | exc | 0.01 | 12 |
| 26 | 33 | exc | unconn | 0.18 | 10.6 |
| 27 | 988 | inh | inh | 0.01 | -8.34 |
| 28 | 894 | inh | inh | 0.01 | -52.9 |
| 29 | 831 | inh | exc | 0.03 | 2.46 |
| 30 | 902 | inh | inh | 0.01 | -59.7 |
| 31 | 897 | inh | inh | 0.01 | -59.3 |
| 32 | 928 | inh | inh | 0.01 | -62.6 |
| 33 | 914 | inh | inh | 0.01 | -27 |
| 34 | 829 | inh | inh | 0.01 | -17.2 |
| 35 | 908 | inh | inh | 0.01 | -89.6 |
| 36 | 922 | inh | inh | 0.01 | -45.9 |
| 37 | 23 | unconn | unconn | 0.42 | 31.2 |
| 38 | 25 | unconn | unconn | 0.6 | -13.3 |
| 39 | 86 | unconn | unconn | 0.33 | -11.2 |
| 40 | 113 | unconn | unconn | 0.64 | -11 |
| 41 | 197 | unconn | unconn | 0.65 | 1.15 |
| 42 | 227 | unconn | unconn | 0.95 | 9.94 |
| 43 | 230 | unconn | unconn | 0.39 | 7.05 |
| 44 | 262 | unconn | unconn | 0.07 | 9.06 |
| 45 | 269 | unconn | unconn | 0.45 | 6.56 |
| 46 | 323 | unconn | unconn | 0.4 | 3.37 |
| 47 | 332 | unconn | unconn | 0.88 | 0.694 |
| 48 | 367 | unconn | exc | 0.02 | 2.77 |
| 49 | 394 | unconn | unconn | 1 | -6.72 |
| 50 | 410 | unconn | unconn | 0.7 | 3.76 |
| 51 | 424 | unconn | unconn | 0.22 | 21.4 |
| 52 | 439 | unconn | unconn | 0.08 | -57.6 |
| 53 | 460 | unconn | unconn | 0.08 | 21.5 |
| 54 | 487 | unconn | unconn | 0.32 | -7.35 |
| 55 | 499 | unconn | exc | 0.01 | 2.17 |
| 56 | 521 | unconn | unconn | 0.37 | 5.41 |
| 57 | 537 | unconn | unconn | 0.22 | -2.49 |
| 58 | 547 | unconn | inh | 0.04 | -18.2 |
| 59 | 599 | unconn | unconn | 0.15 | -10.6 |
| 60 | 612 | unconn | inh | 0.01 | -34.3 |
| 61 | 646 | unconn | unconn | 0.39 | -1.08 |
| 62 | 669 | unconn | unconn | 0.27 | -20 |
| 63 | 702 | unconn | unconn | 0.49 | -21 |
| 64 | 722 | unconn | unconn | 0.52 | -5.28 |
| 65 | 768 | unconn | unconn | 0.33 | 22.8 |
| 66 | 790 | unconn | unconn | 0.58 | -0.542 |
| 67 | 813 | unconn | unconn | 0.46 | -23.2 |
| 68 | 821 | unconn | unconn | 0.5 | -3.52 |
| 69 | 842 | unconn | unconn | 0.08 | 6.56 |
| 70 | 843 | unconn | unconn | 0.27 | 10.1 |
| 71 | 875 | unconn | unconn | 0.49 | -47.3 |
| 72 | 882 | unconn | unconn | 0.16 | -5.13 |
| 73 | 896 | unconn | unconn | 0.86 | -20.6 |
| 74 | 921 | unconn | unconn | 0.88 | -3.81 |
| 75 | 956 | unconn | unconn | 0.7 | -10.5 |
| 76 | 977 | unconn | exc | 0.04 | 21.7 |
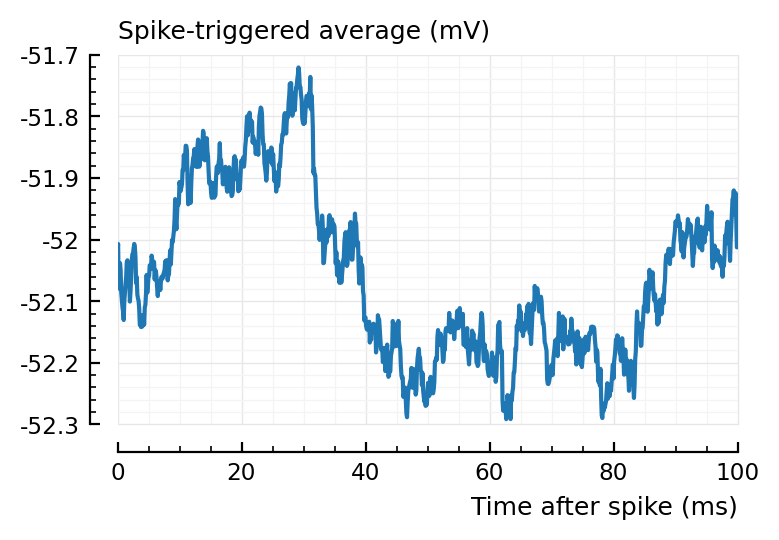
Inhibitory input misclassified
one inh misclassified:
Plot.plotSTA(from::Int, to::Int, s, p, kw...) = plotSTA(s.signals[to].v, s.spike_times[from], p, kw...)
plotSTA(831, 1, s, p);
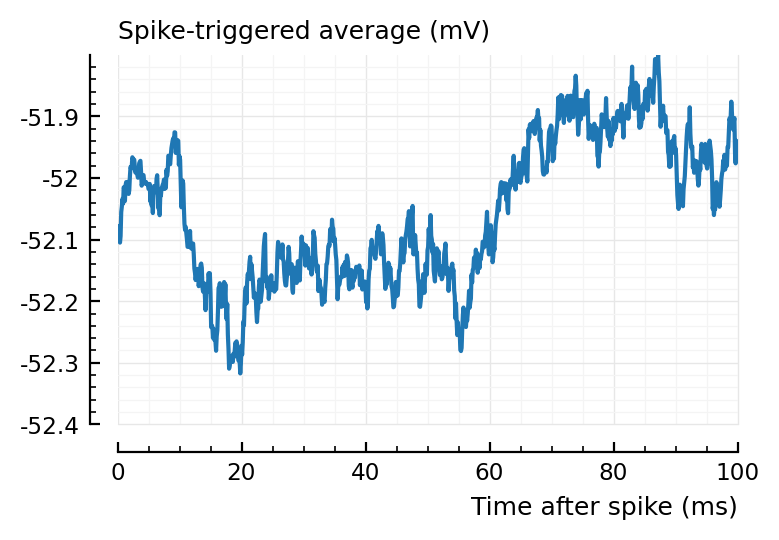
Not so clear. A clearer one:
plotSTA(894, 1, s,p);
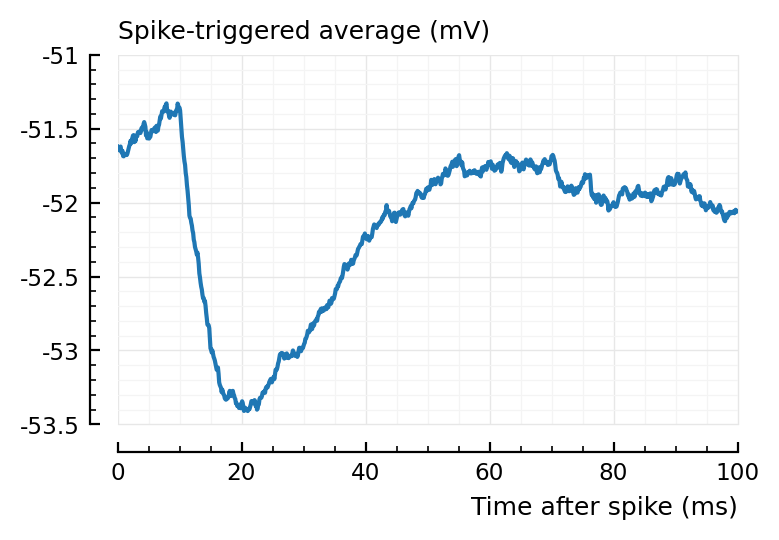
But yeah, it would be fixed with a shorter STA window.
Exc input misclassified
plotSTA(145, 1, s,p);
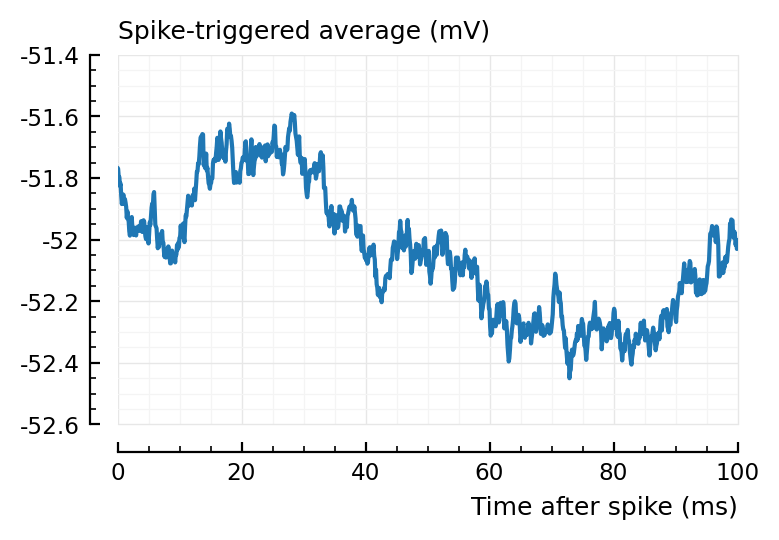
plotSTA(681, 1, s,p);
And again, shorter window would mitigate.
Average STA window
For every recorded (exc) neuron..
    for all it's (exc) inputs..
        calc STA, and grand average all those
calcSTA(from::Int, to::Int, s, p) = calc_STA(s.signals[to].v, s.spike_times[from], p);
function calcMeanSTA(post; pre)
    avgSTA = nothing
    N = 0
    @showprogress for n in post
        ii = s.input_info[n]
        if pre == :exc
            inputs = ii.exc_inputs
        elseif pre == :inh
            inputs = ii.inh_inputs
        elseif pre == :FP
            perf = cached_conntest_eval(s,n,p)
            tn = perf.tested_neurons
            is_FP = (tn.real_type .== :unconn) .& (tn.predicted_type .!= :unconn)
            inputs = tn.input_neuron_ID[is_FP]
        end
        for m in inputs
            STA = calcSTA(m, n, s, p)
            if isnothing(avgSTA) avgSTA = STA
            else avgSTA .+= STA end
            N += 1
        end
    end
    return avgSTA ./ N
end;
avgSTA_EE = calcMeanSTA(exc_post, pre=:exc)
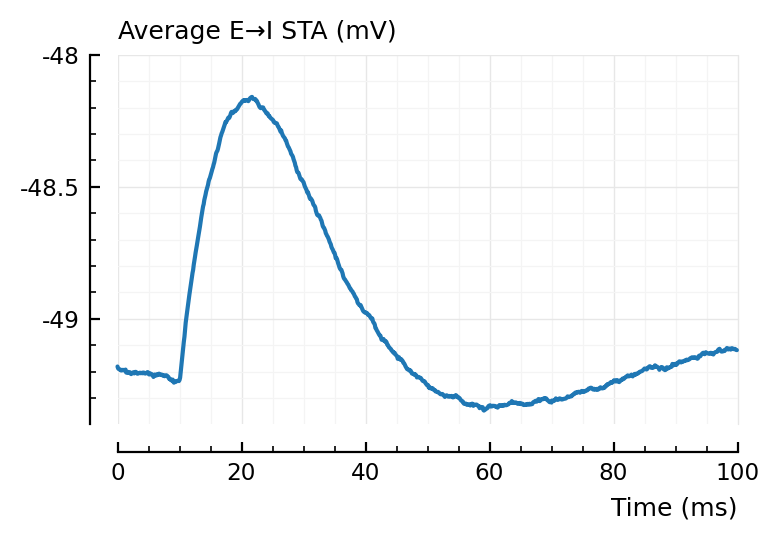
avgSTA_EI = calcMeanSTA(inh_post, pre=:exc)
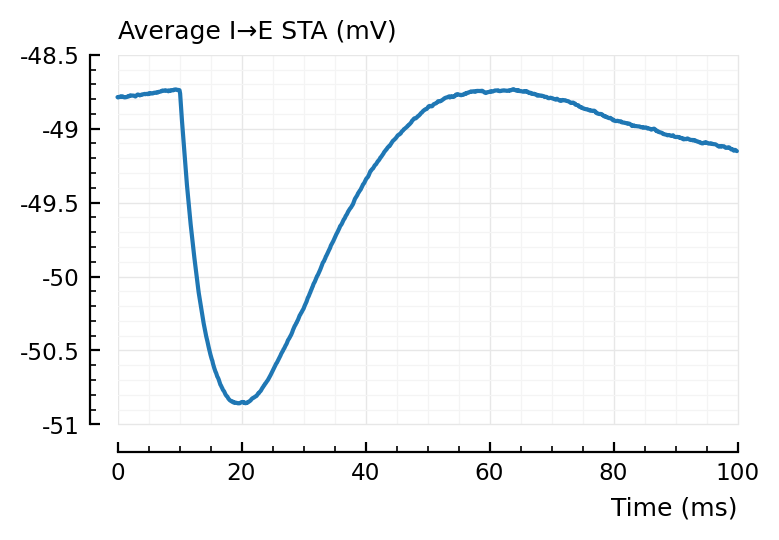
avgSTA_IE = calcMeanSTA(exc_post, pre=:inh)
avgSTA_II = calcMeanSTA(inh_post, pre=:inh);
Progress: 100%|█████████████████████████████████████████| Time: 0:00:05
Progress: 100%|█████████████████████████████████████████| Time: 0:00:01
Progress: 100%|█████████████████████████████████████████| Time: 0:00:01
Progress: 100%|█████████████████████████████████████████| Time: 0:00:00
avgSTA_FP_E = calcMeanSTA(exc_post, pre=:FP)
avgSTA_FP_I = calcMeanSTA(inh_post, pre=:FP);
Progress: 100%|█████████████████████████████████████████| Time: 0:00:01
Progress: 100%|█████████████████████████████████████████| Time: 0:00:00
function Plot.plotsig(x, p::ExpParams; tscale = ms, kw...)
    duration = length(x) * p.sim.general.Δt
    t = linspace(zero(duration), duration, length(x)) / tscale
    xlabel = (tscale == ms) ? "Time (ms)" :
             (tscale == seconds) ? "Time (s)" :
             (tscale == minutes) ? "Time (minutes)" : ""
    plotsig(t, x; xlabel, kw...)
end;
plotsig(avgSTA_EE / mV, p, hylabel="Average E→E STA (mV)", ylim=[-49.4, -48]); plt.subplots();
plotsig(avgSTA_EI / mV, p, hylabel="Average E→I STA (mV)", ylim=[-49.4, -48]); plt.subplots();
plotsig(avgSTA_IE / mV, p, hylabel="Average I→E STA (mV)", ylim=[-51, -48.5]); plt.subplots();
plotsig(avgSTA_II / mV, p, hylabel="Average I→I STA (mV)", ylim=[-51, -48.5]); plt.subplots();
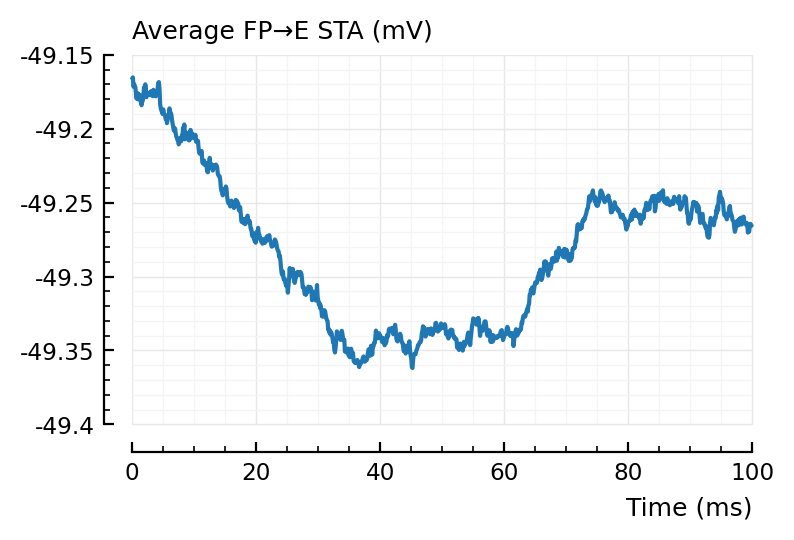
plotsig(avgSTA_FP_E / mV, p, hylabel="Average FP→E STA (mV)"); plt.subplots();
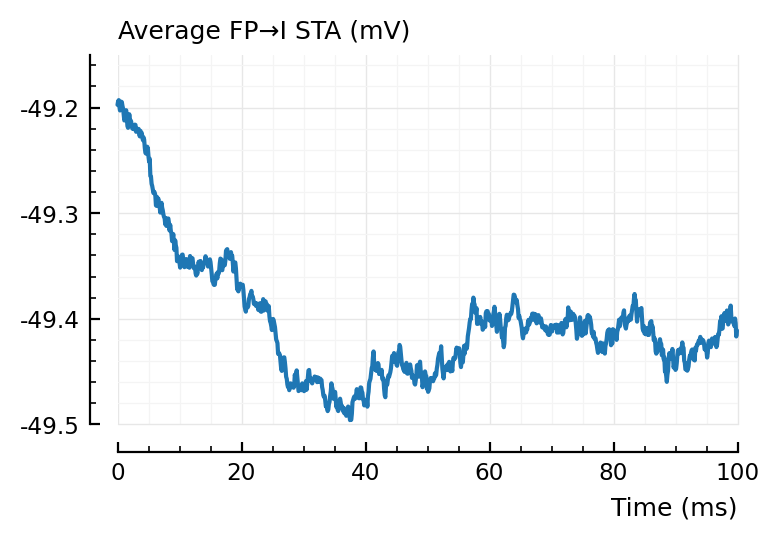
plotsig(avgSTA_FP_I / mV, p, hylabel="Average FP→I STA (mV)");
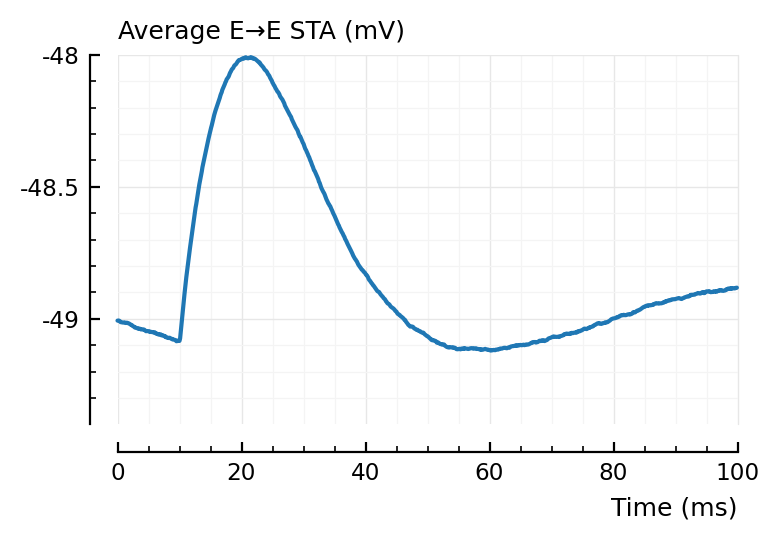
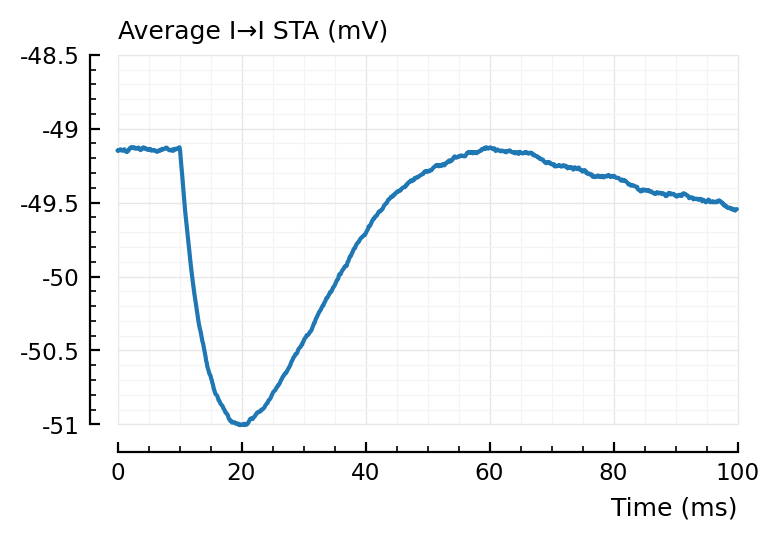
Inhibitory neurons seem to have a lower average voltage, from looking at their STA baselines.
avg_voltage(group) = mean([mean(s.signals[n].v) for n in group])

avg_voltage(exc_post) / mV
-49
avg_voltage(inh_post) / mV
-49.2
Yup, that tracks.
For the average false positive STAs, we indeed see the 2 x (propagation + integration delay) (± 40 ms) dip seen before.
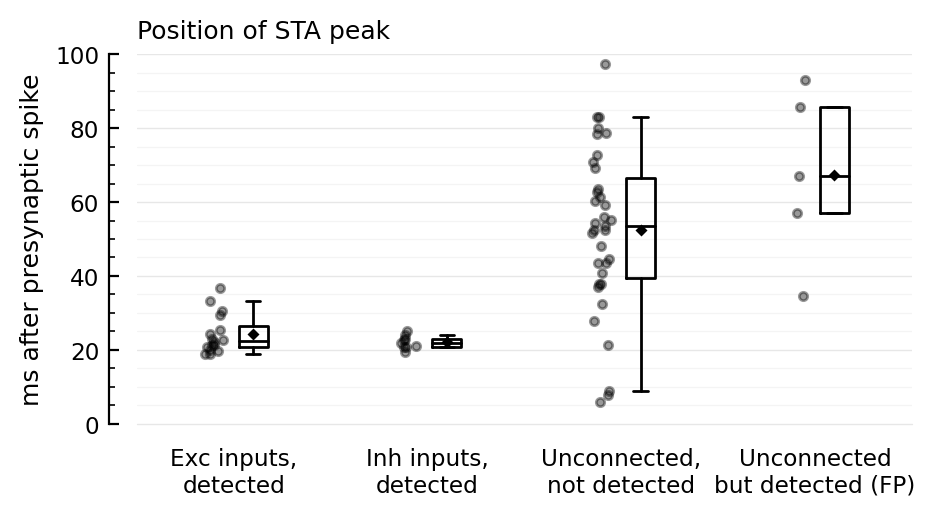
Disynaptic false positive (FP) hypothesis
We suspect false positive detections are due to an intermediary connected neuron.
A → B → C
A fires, makes B fire¹, which generates a PSP in the recorded neuron C.
But this PSP happens with a larger delay after the A spike than if A would be directly connected to C.
So let’s test if the peak of the STA of unconnected-but-detected (i.e. FP) neurons occurs later than the peak of non-detected unconnected neurons (the timing of which should be random).
¹(sometimes at least)
tn = perf.tested_neurons;
# We'll add columns: for every neuron (tp exc, tp inh, fp, tn),
# we'll calc when the peak occurs (max or min, depending on area-over-start) and add that.
m = 1;
peak_over_start = Float64[]
peakpos_ms = Float64[]
for row in eachrow(tn)
    STA = calcSTA(row.input_neuron_ID, m, s,p)
    f = (row.area_over_start > 0) ? findmax : findmin
    peak, peakpos = f(STA)
    push!(peak_over_start, (peak - STA[1]) / mV)
    push!(peakpos_ms, peakpos * p.sim.general.Δt / ms)
end
tn.peak_over_start = peak_over_start
tn.peakpos_ms = peakpos_ms;
ENV["COLUMNS"] = 100; # show all columns of df
ydistplot(
    jn("Exc inputs,", "detected")          => tn.peakpos_ms[(tn.real_type .== :exc) .& (tn.predicted_type .== :exc)],
    jn("Inh inputs,", "detected")          => tn.peakpos_ms[(tn.real_type .== :inh) .& (tn.predicted_type .== :inh)],
    jn("Unconnected,", "not detected")     => tn.peakpos_ms[(tn.real_type .== :unconn) .& (tn.predicted_type .== :unconn)],
    jn("Unconnected", "but detected (FP)") => tn.peakpos_ms[(tn.real_type .== :unconn) .& (tn.predicted_type .!= :unconn)],
    figsize = (5, 2.4),
    hylabel = "Position of STA peak",
    ylabel = "ms after presynaptic spike",
);