Last save: {{ last_save_pretty }}
Event {{ activeEvent.id + 1 }}
Label potential SWR events

Thanks for taking the time to help.

Settings

Please select your name, and the subset of events you want to label:

Waiting for backend to wake up...
(This should take about 10 seconds)

Controls
  • Arrow keys < and > to move between events. (You can also use the mouse).
  • Arrow keys ^ and v to label the selected event as either "Probably a sharp-wave ripple" or "Probably not a sharp-wave ripple", respectively. (Or use the buttons in the top right corner).

Data & plots

Information about what you see in the plots can be found under the "Info" button.

Thanks again and good luck!

What's in the plots
Data
We analyse an LFP recording from Michon et al. 2016, made with a 16-electrode "L"-style probe. (Specifically probe number "L2"). The data is filtered between 0.1 and 500 Hz.
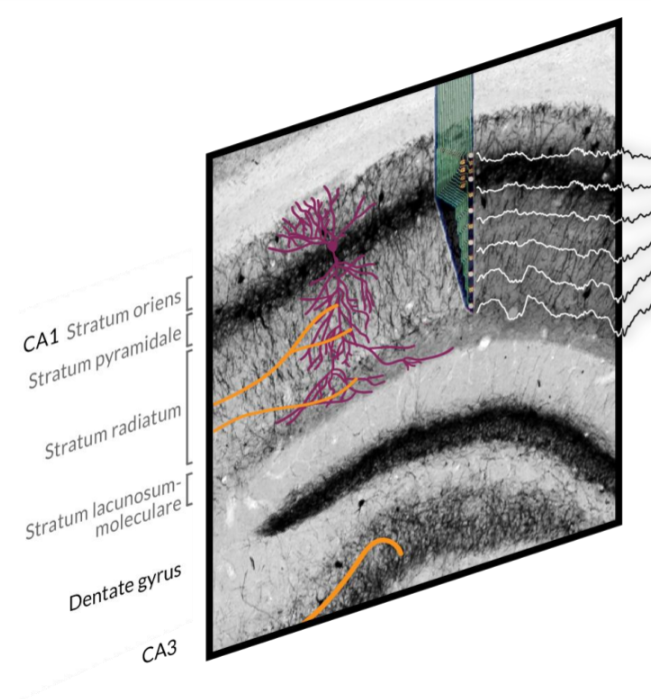
Rough estimation of the position of the probe with respect to the layers of CA1. Only five of the 16 voltage traces are drawn here.
Plots

Each event in the list at the top is represented by two voltage traces: one from an electrode in the pyramidal cell layer (the top trace), and one from an electrode in the stratum radiatum.

The large plot at the bottom gives more comprehensive view of the current event: all 16 channels are plotted (instead of only two), and the plot ranges from 1000 ms before to 1000 ms after the event.

In this large plot, the blue vertical line marks the currently active event. The grey vertical lines correspond to other detected events. The scalebar at the beginning of this plot represents 1 mV.